Agency complete Digital Marketing template (8 in 1) on Google Data Studio

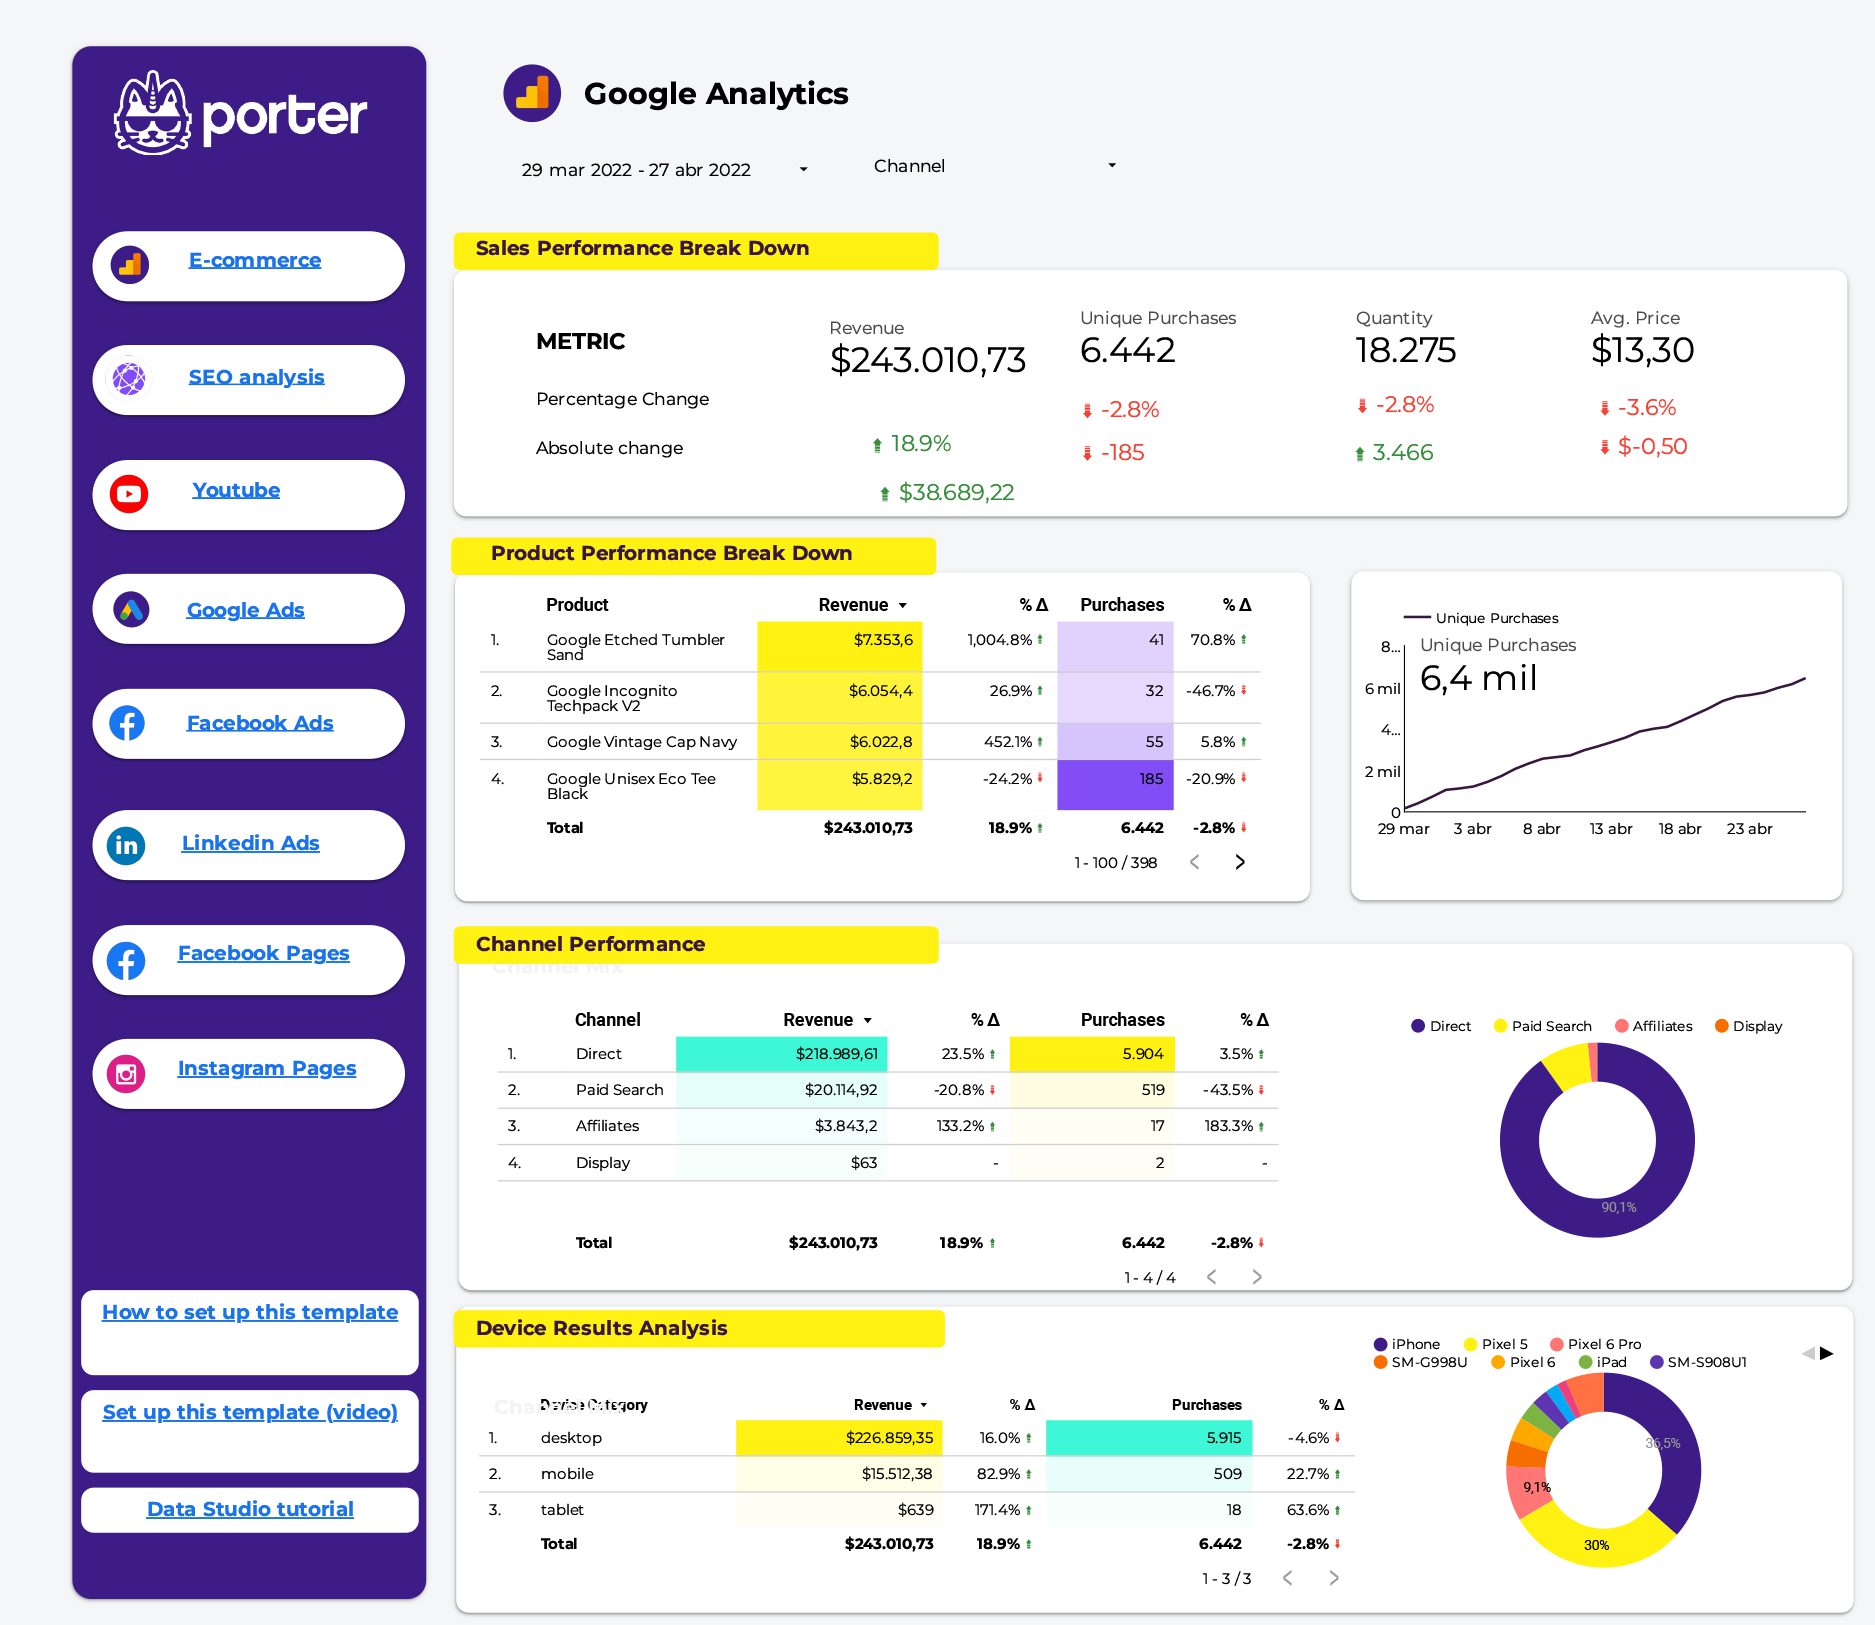
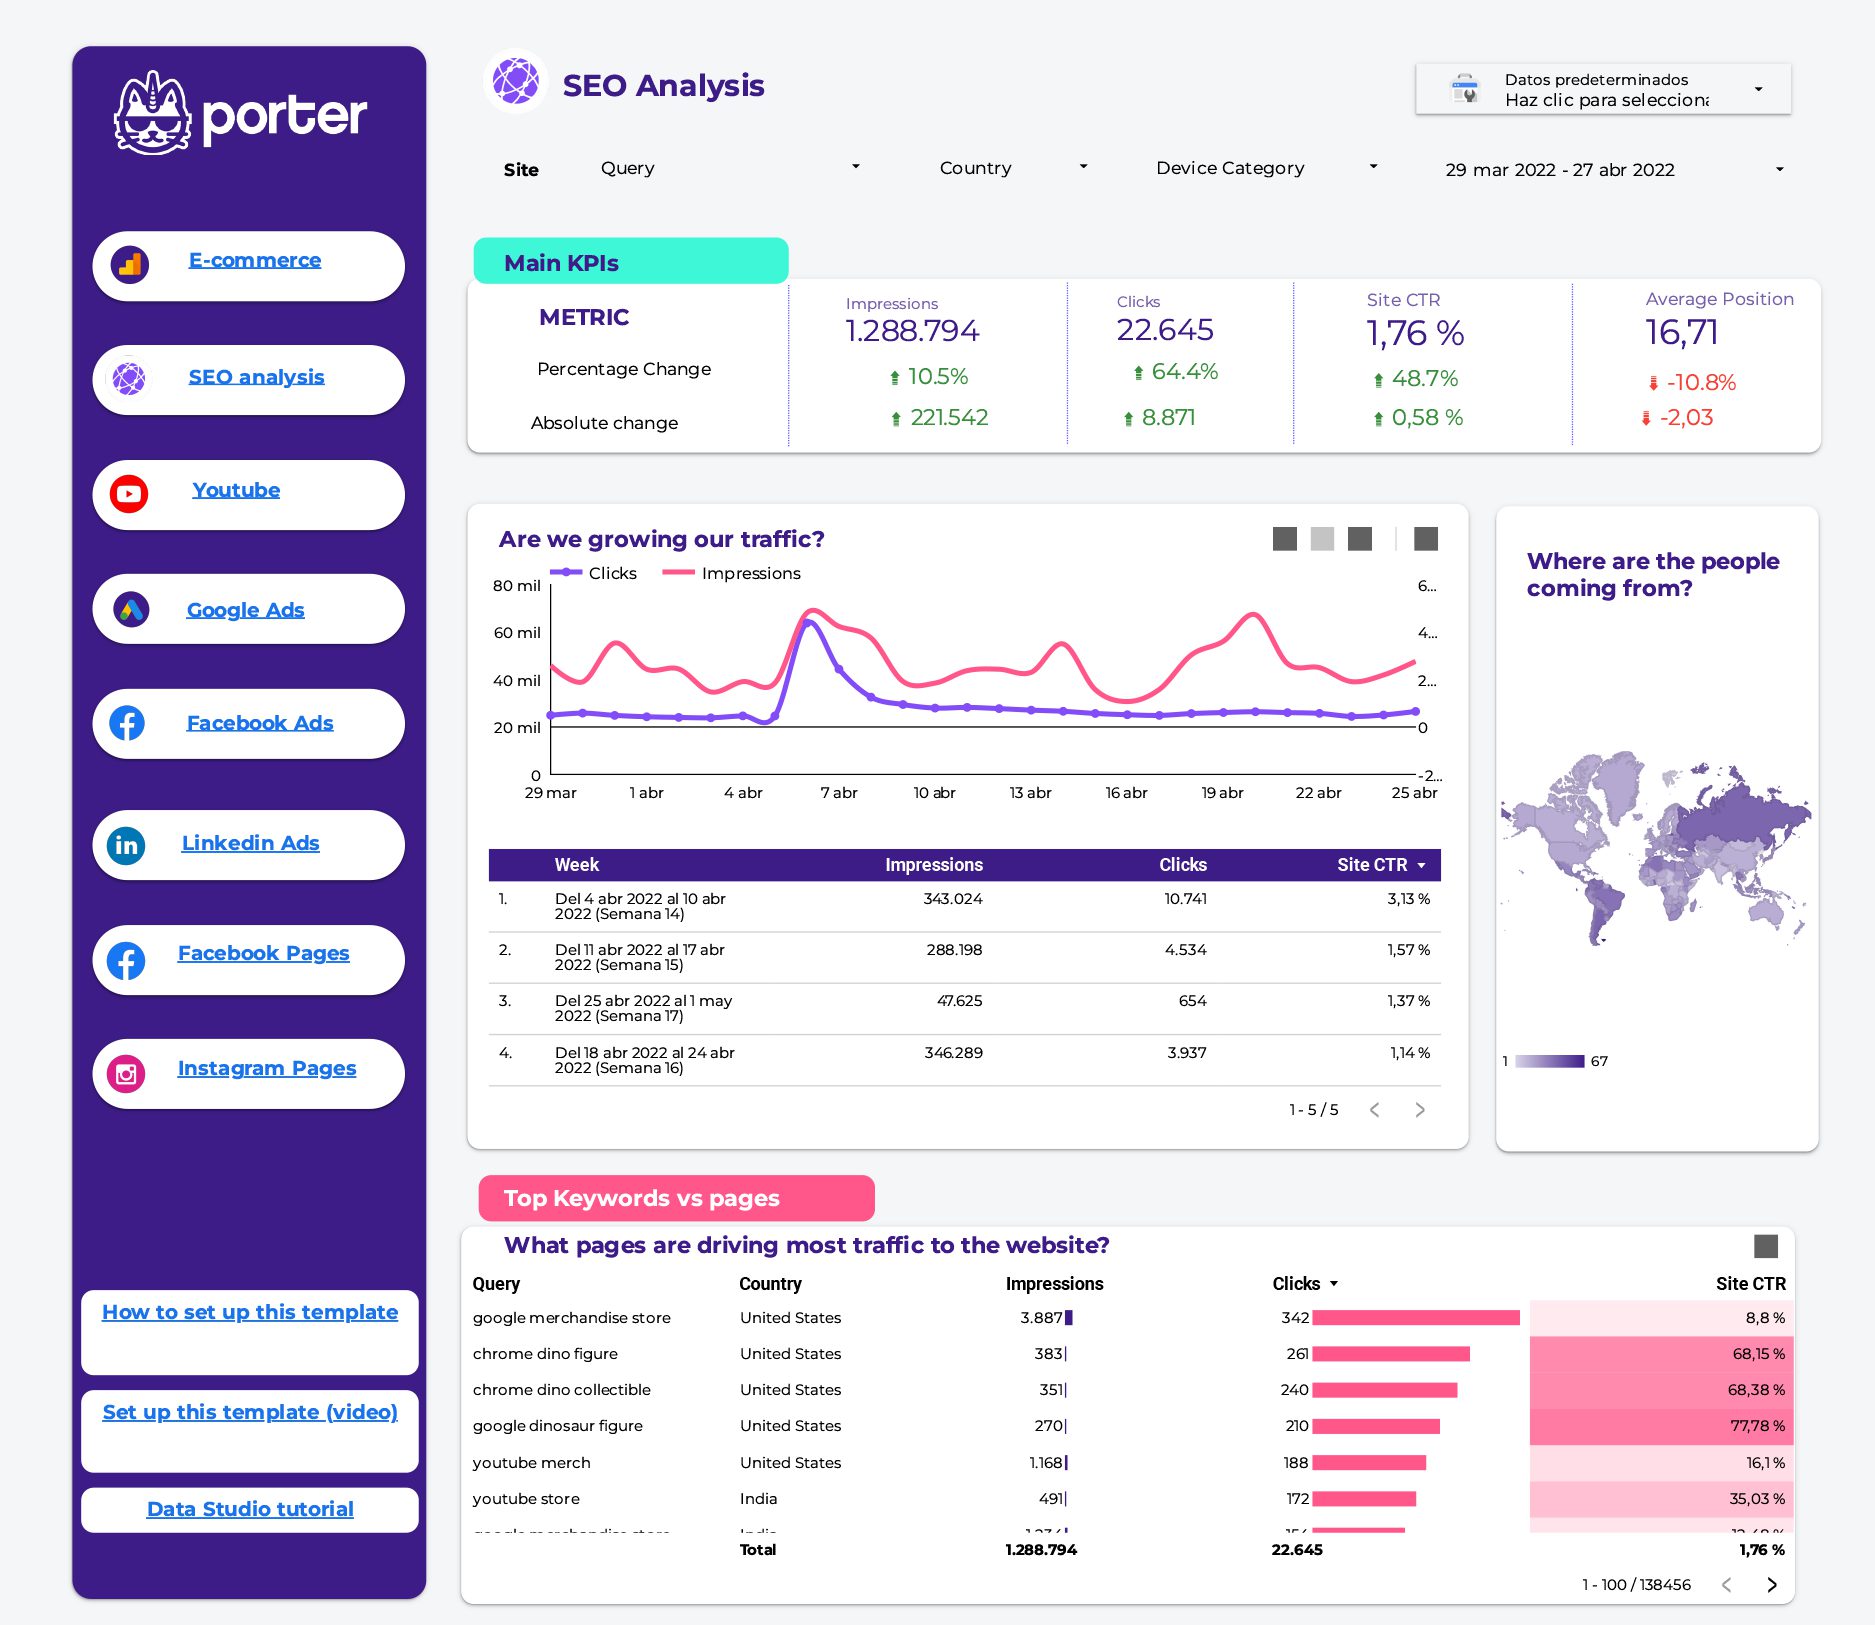
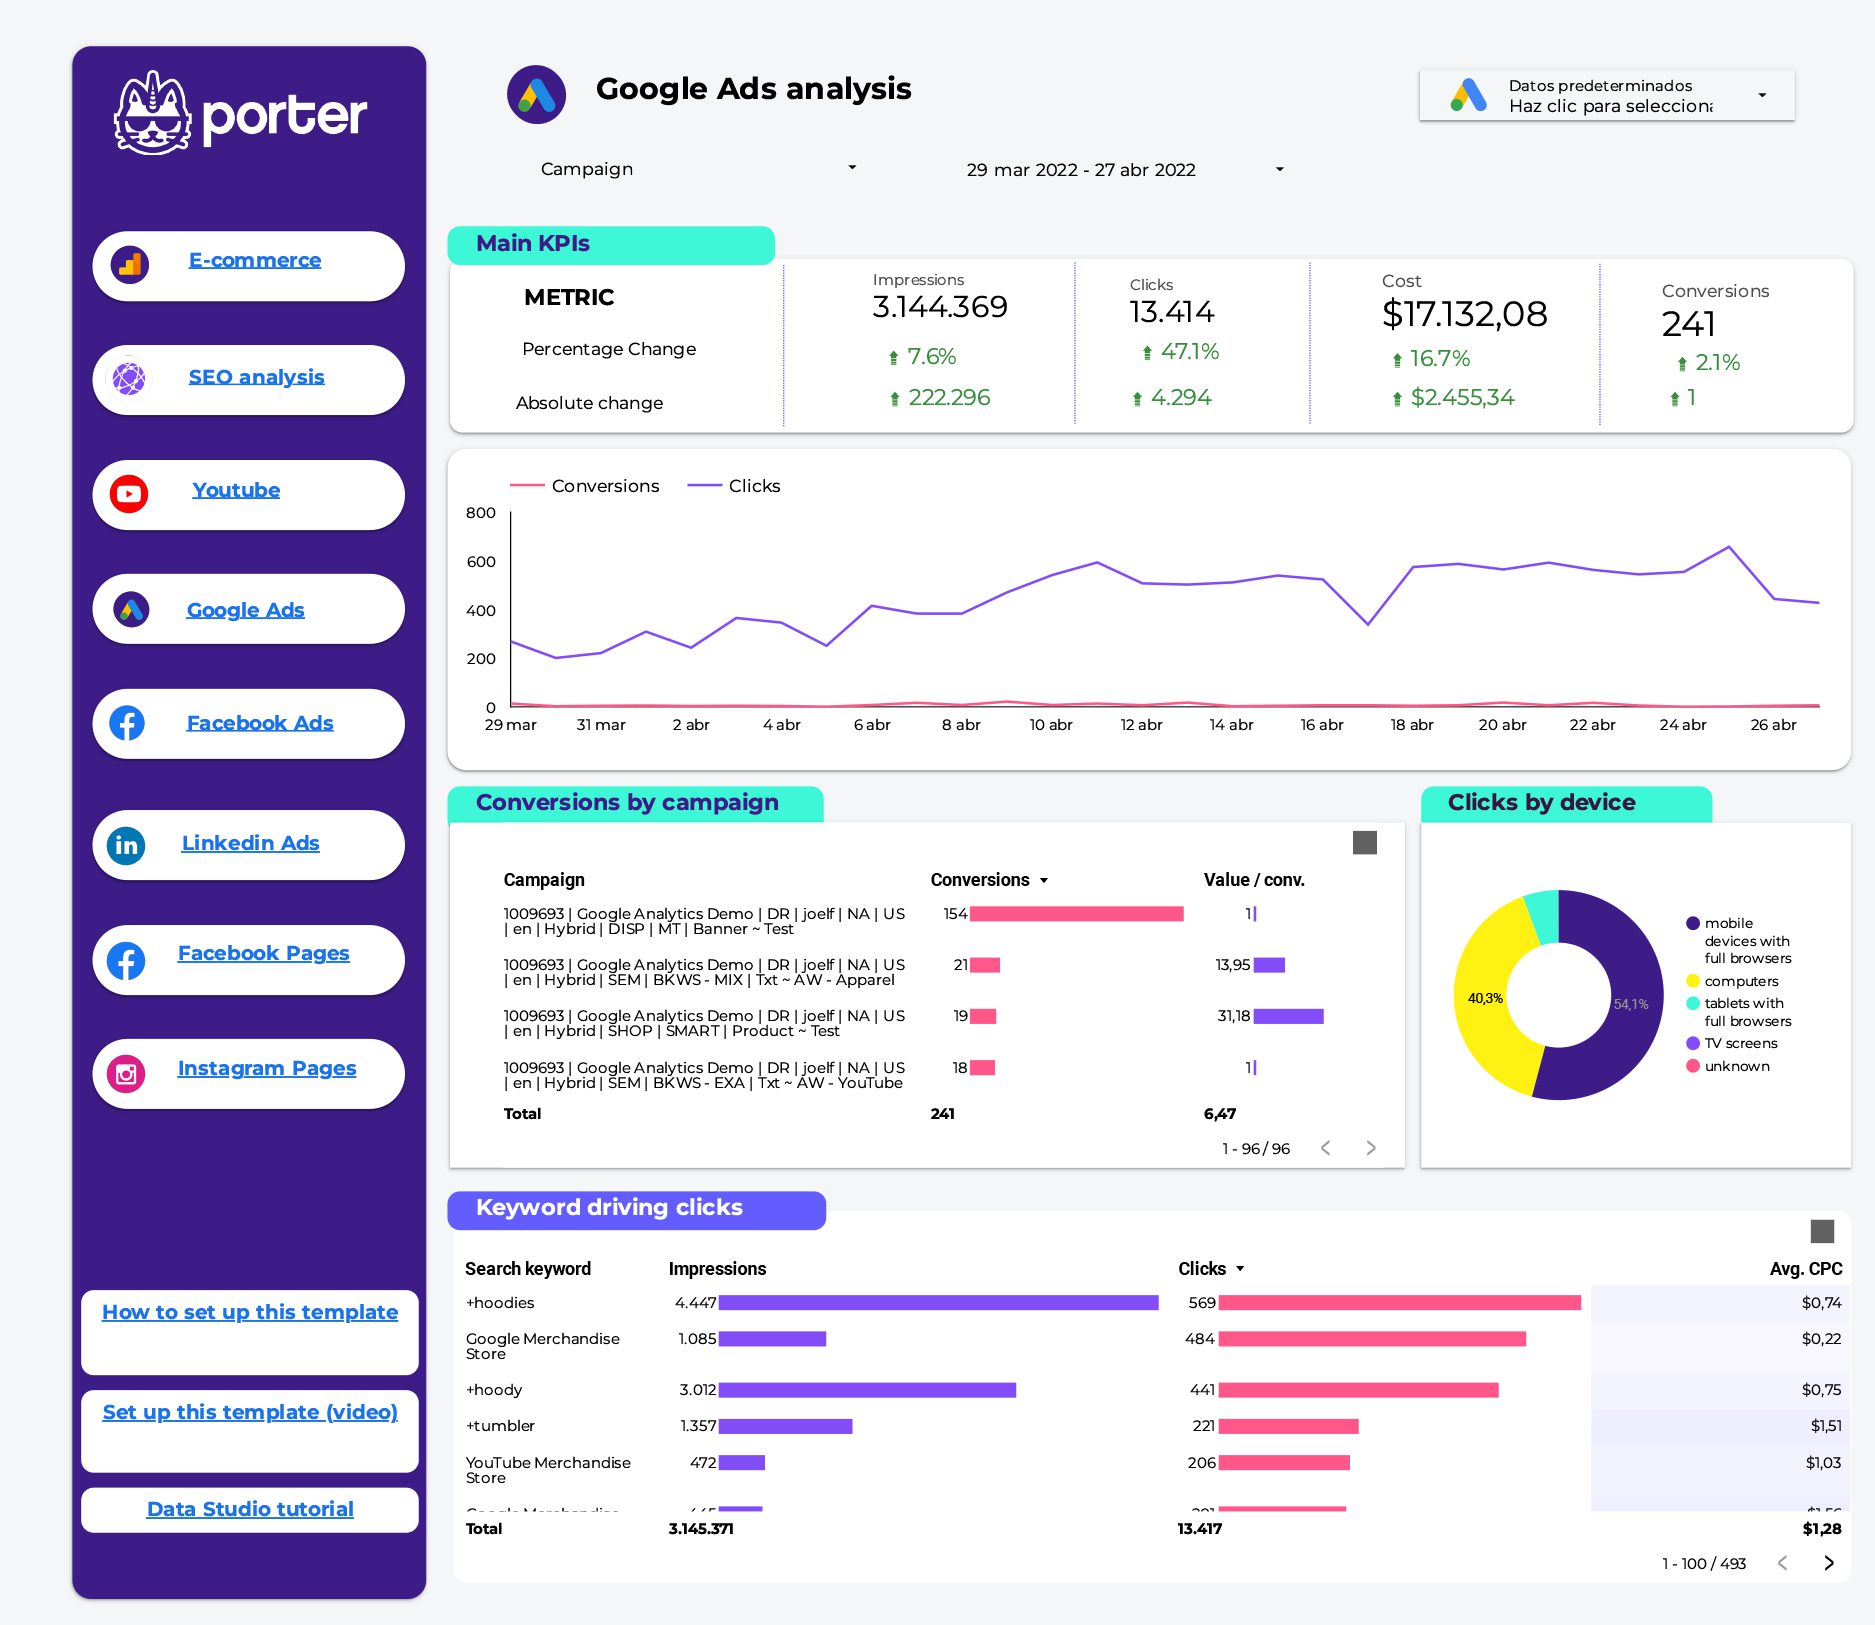
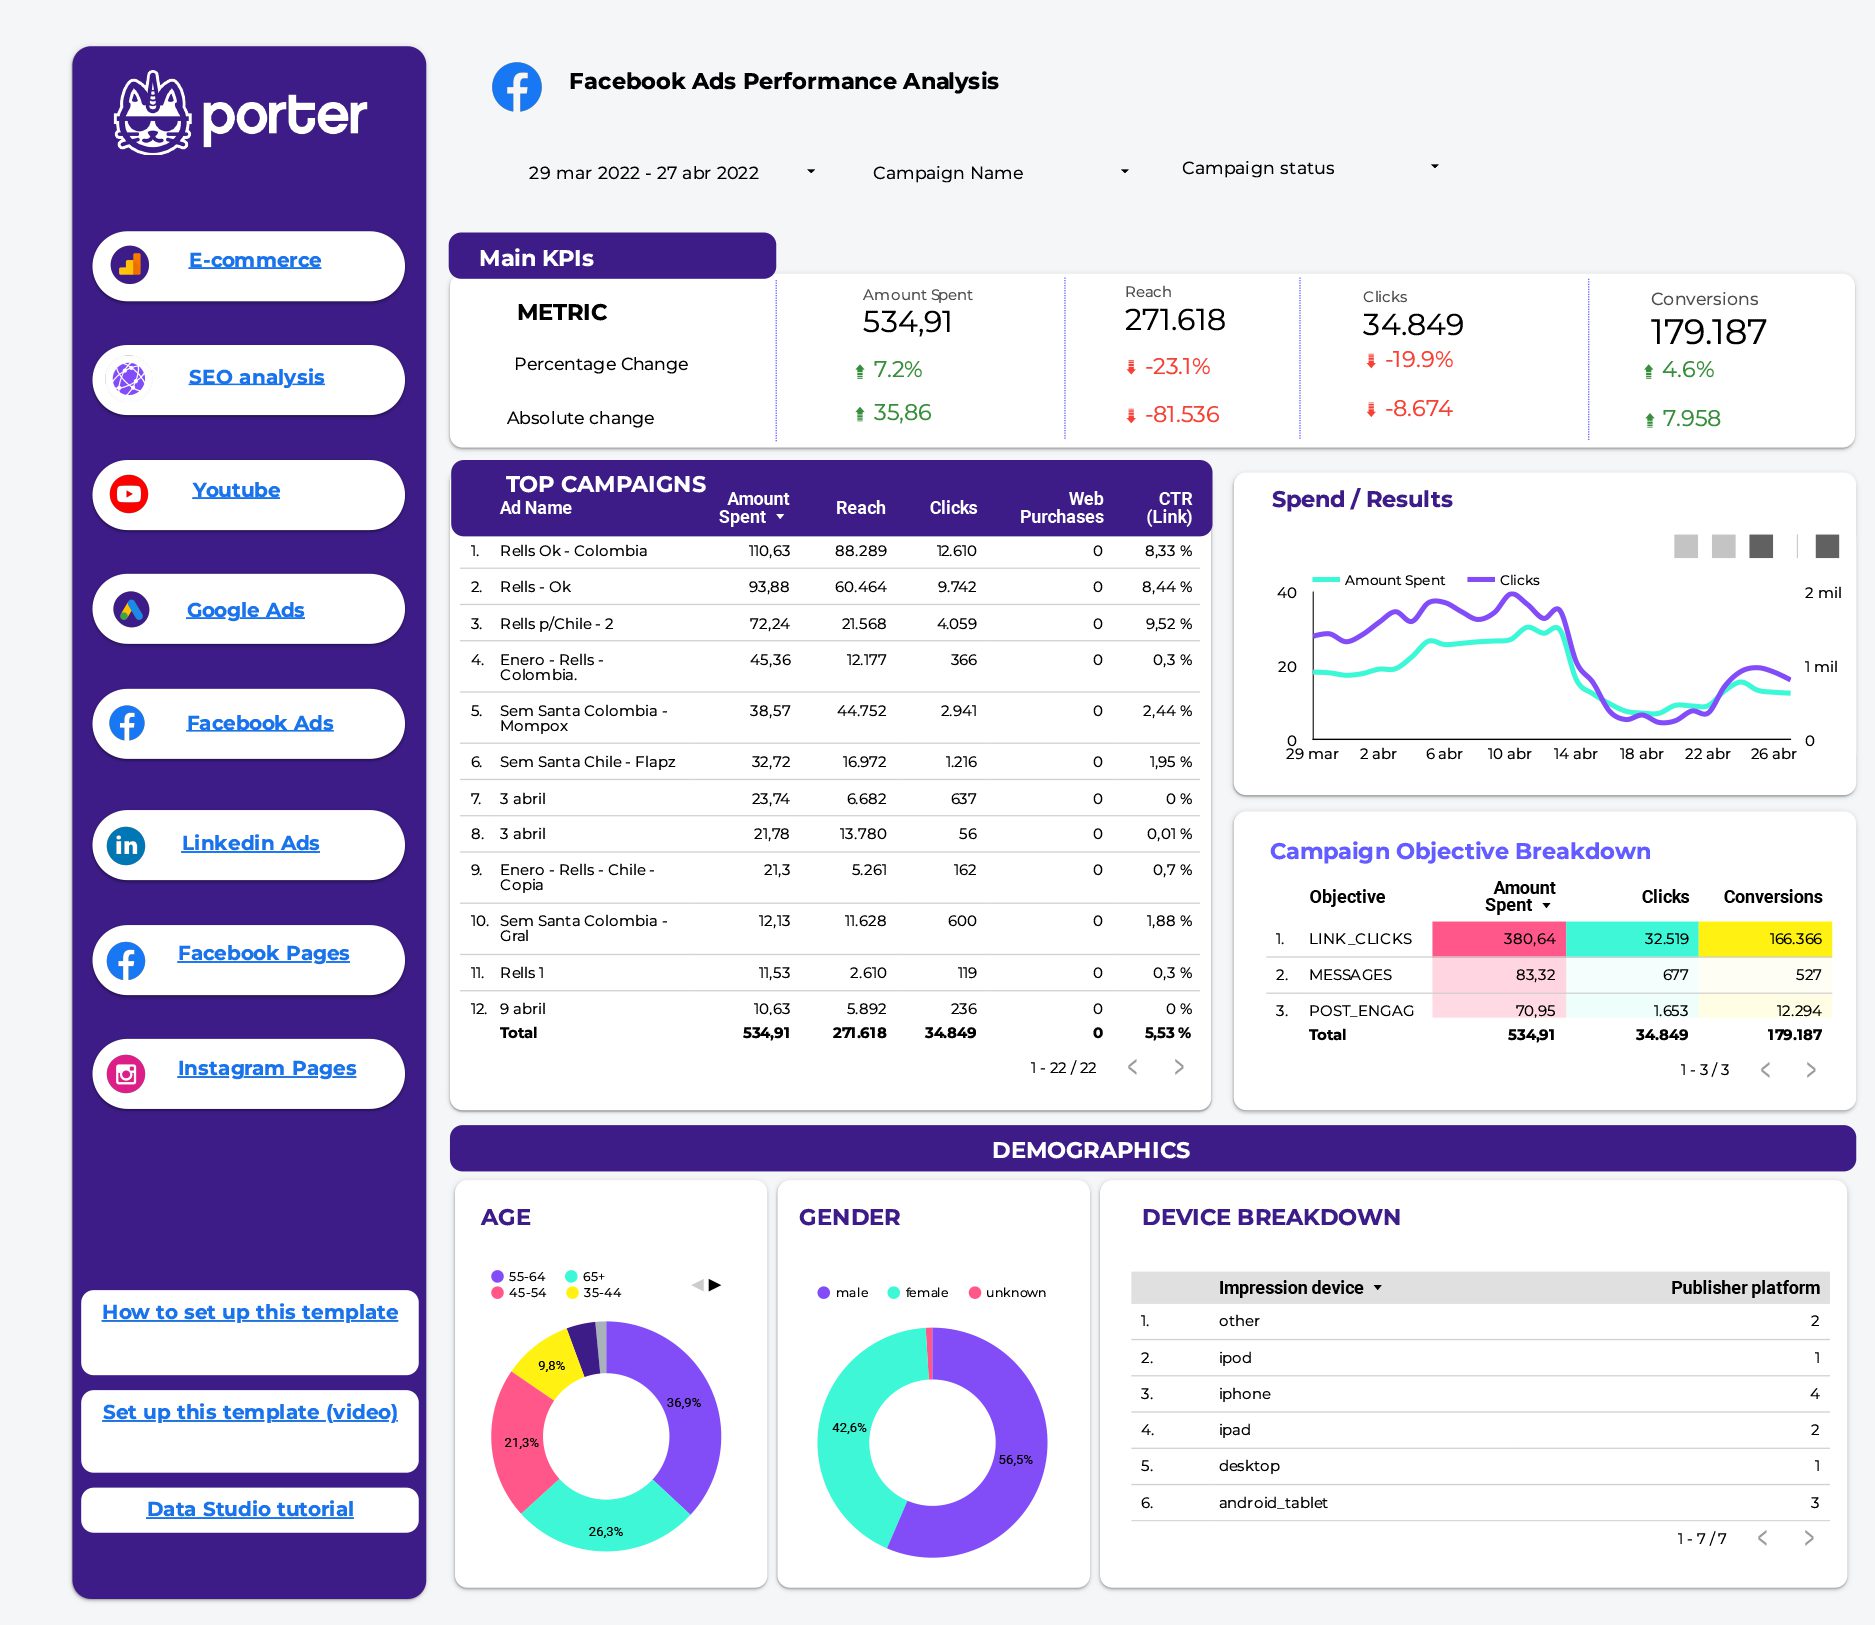
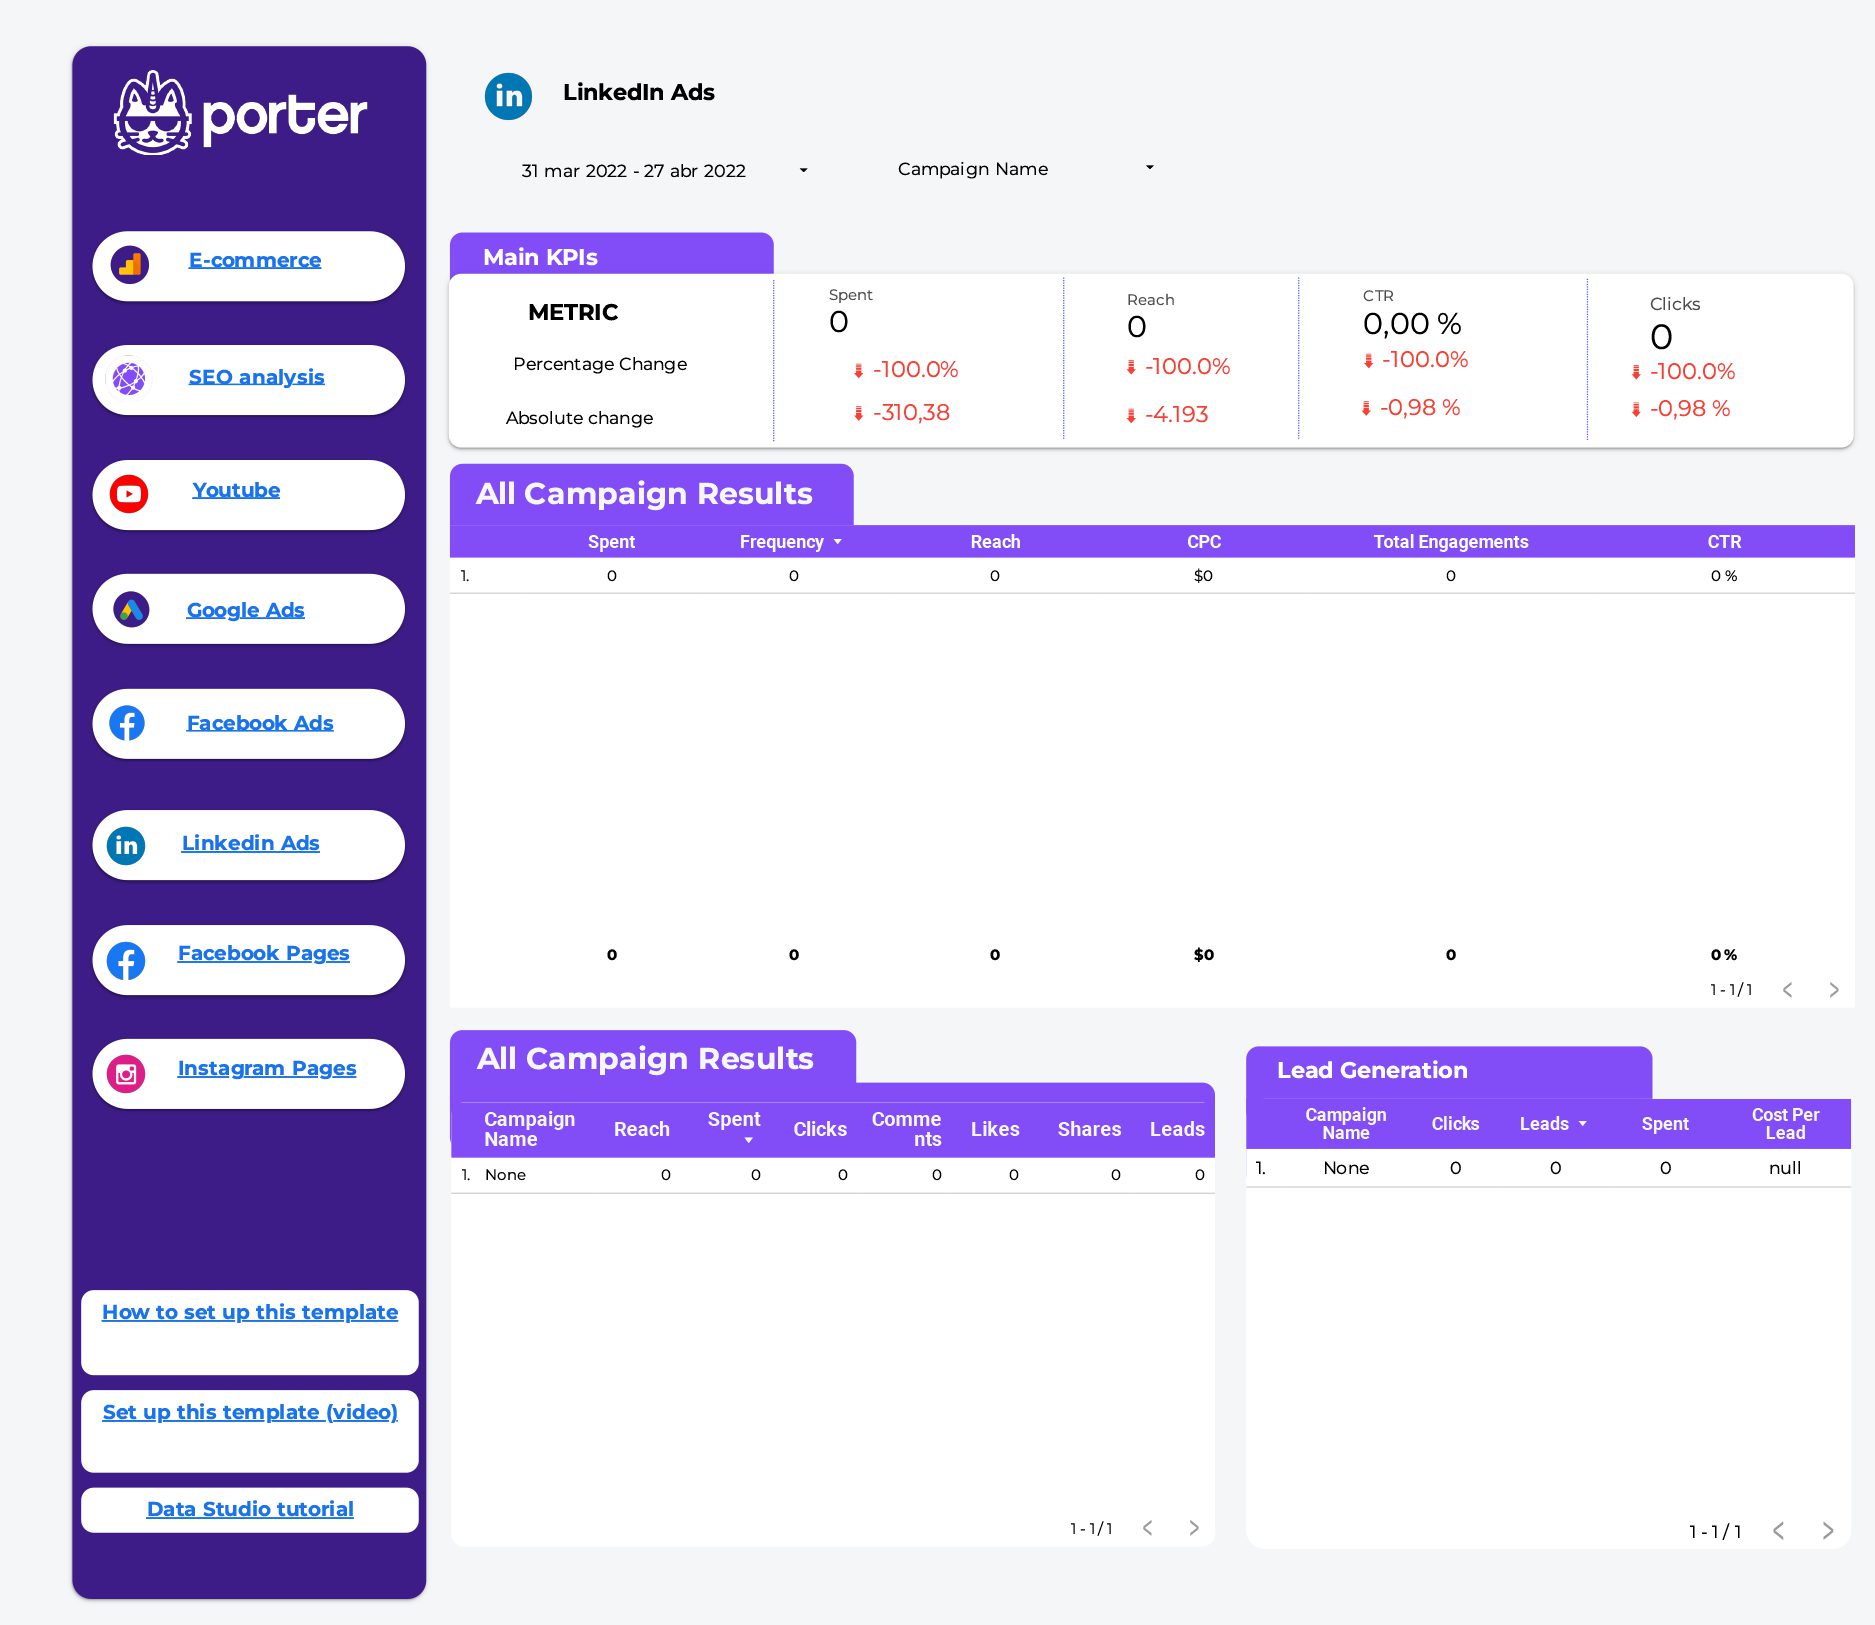
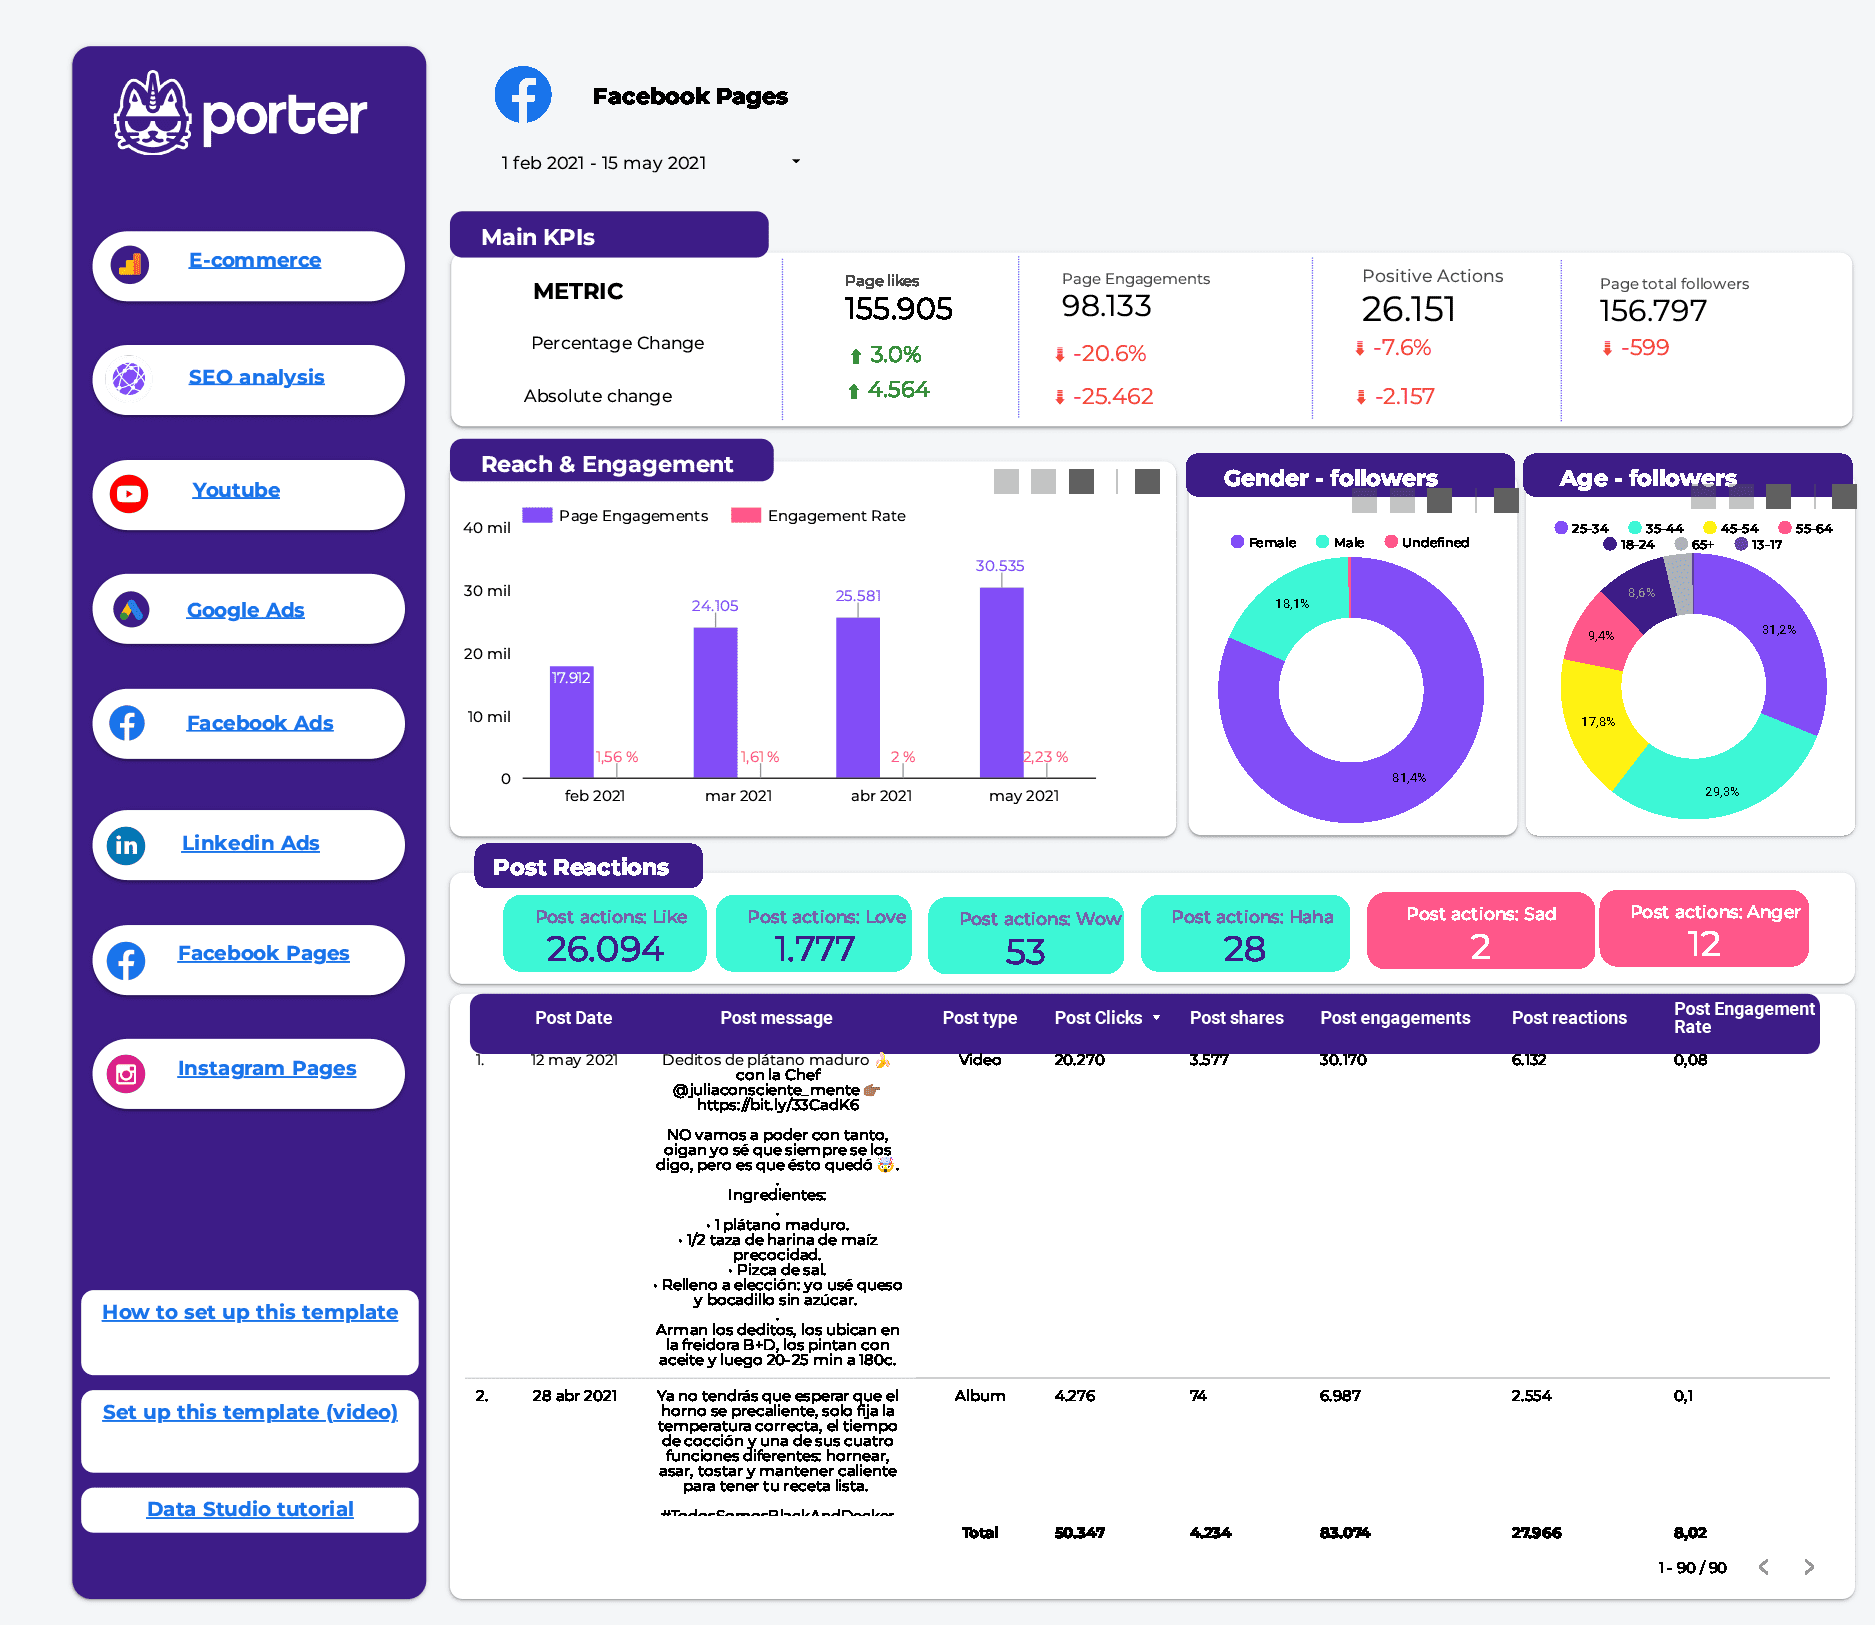
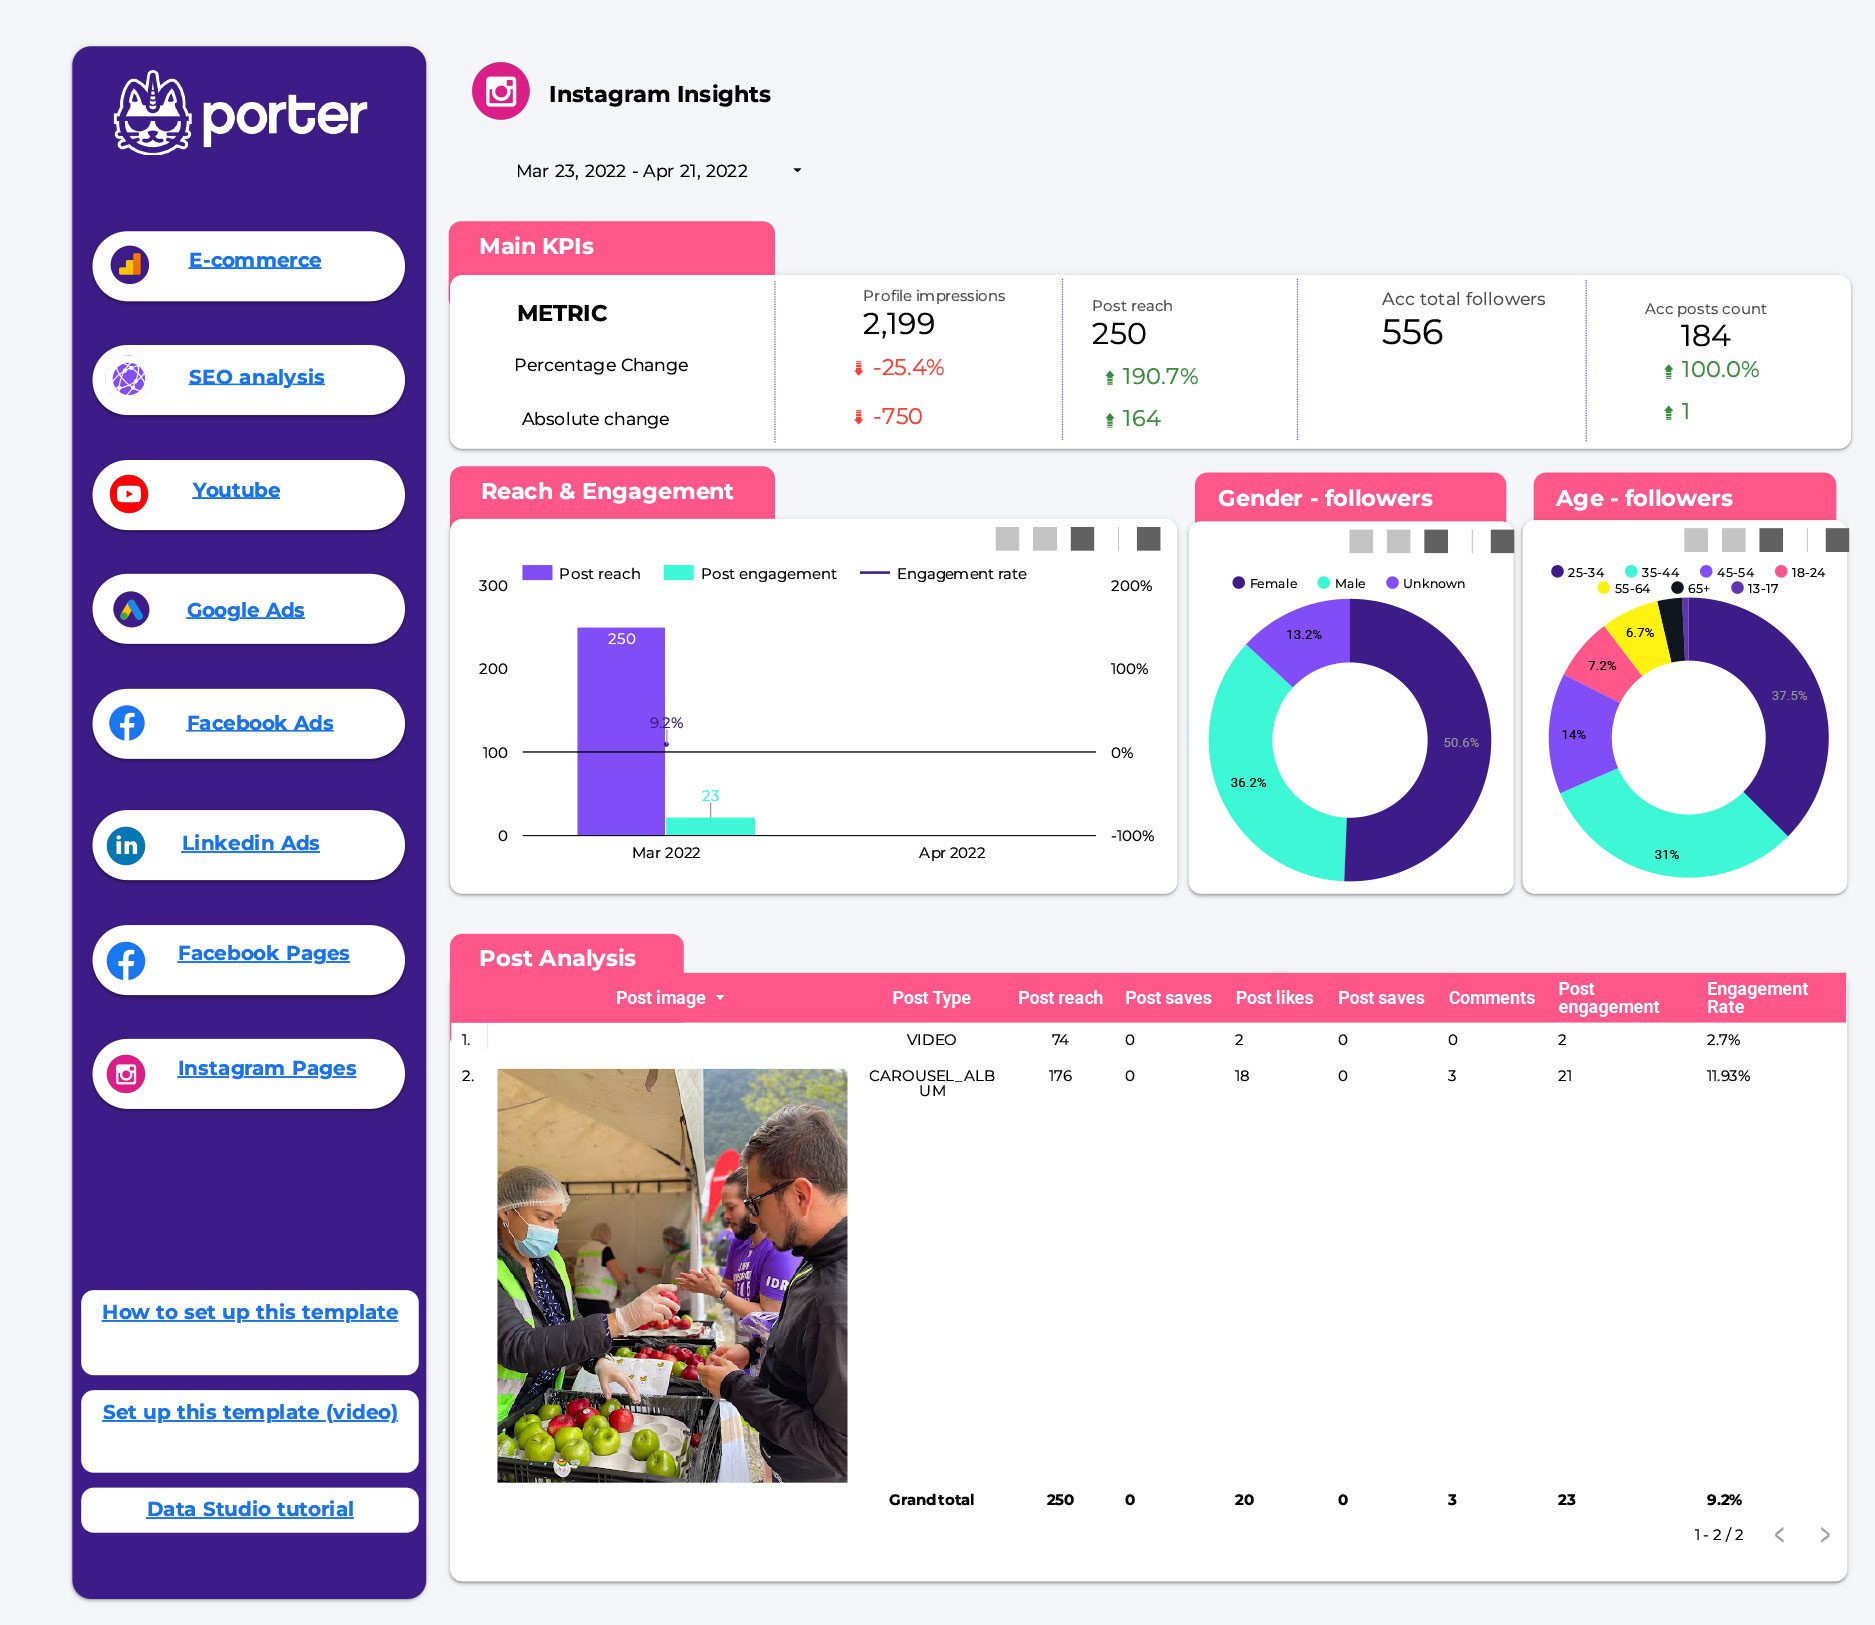
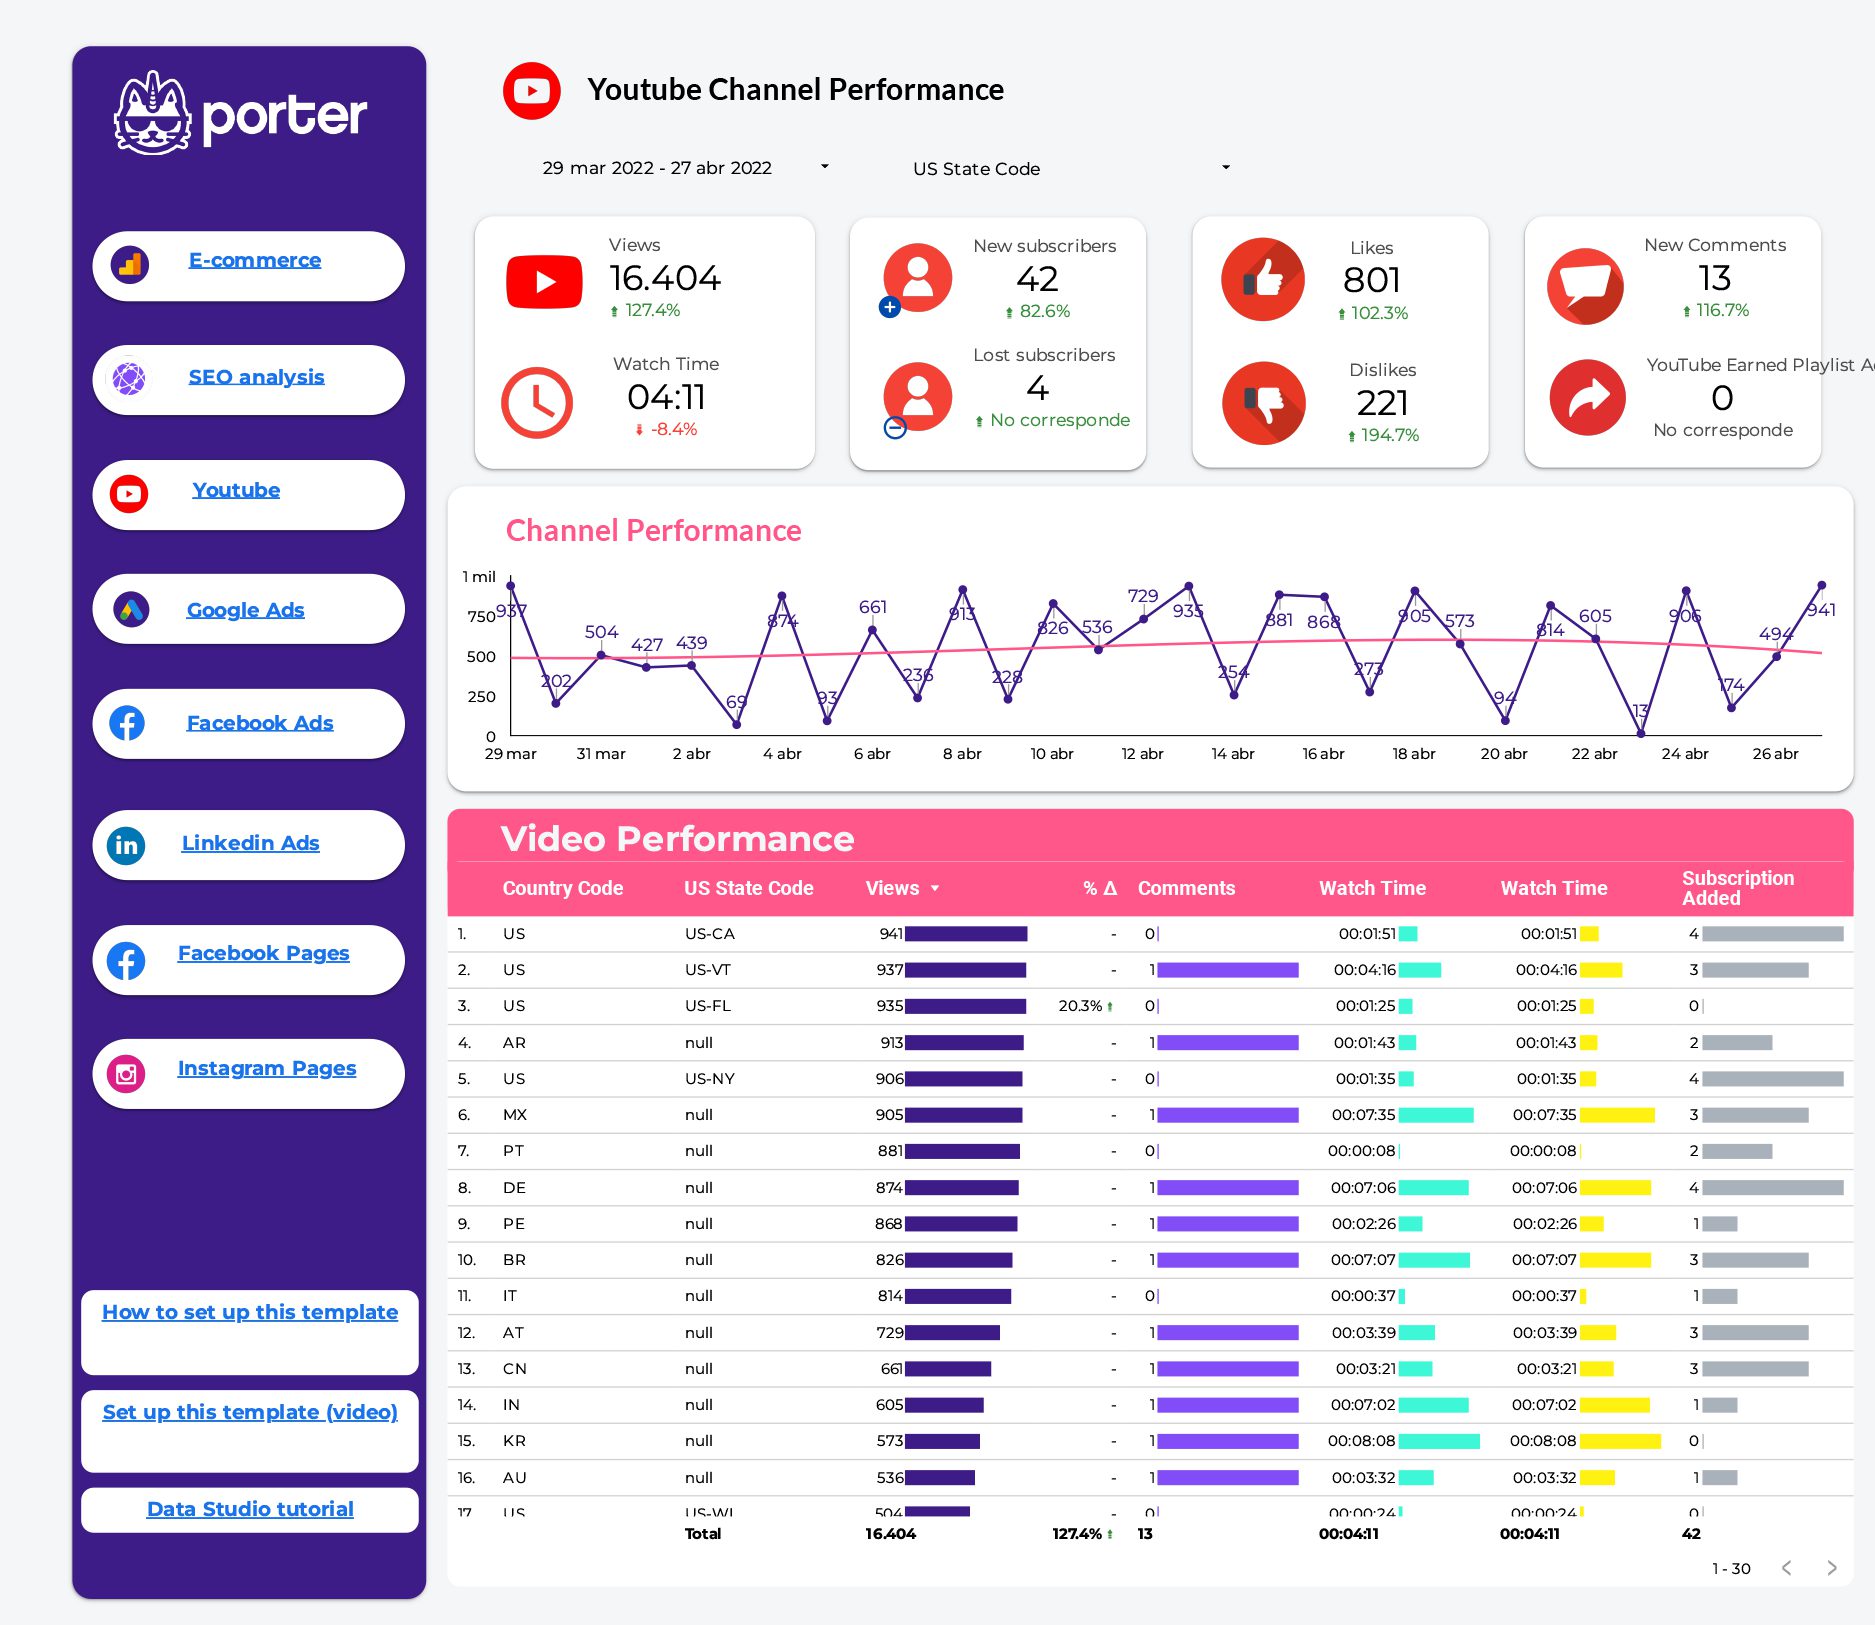
Do you want to integrate all your digital marketing channels in one place? This template includes data from Google Analytics, SEO, Youtube, Facebook Page Insights, Instagram Page Insights, Linkedin Ads, and Facebook & Instagram Ads.

Template Overview

This is one of the most complete templates we have created so far. Some people sell this kind of template for over USD 140. We give it to you, free. 

Why? We know that the only way for you to experience the value of Data Studio and marketing automation is through use cases. And you can do that using the connectors we have developed to help marketing teams like yours.

Organic data sources:

  • Google Analytics: understand your e-commerce data, sales, purchases, quantity, average ticket, product performance, e-commerce conversion rate, channel performance, and demographic analysis.
  • SEO analysis: understand if you are growing your traffic, which are the pages driving the most traffic to your website, your top keywords, and more. Find metrics such as impressions, URL clicks, CTR, number of queries, countries with the most traffic, and more.
  • Youtube: understand your organic growth with metrics such as views, average watch time, new subscribers, lost subscribers, likes, dislikes, comments, video shares. Also, get specific insights from your video performance analysis visualizing: thumbnail image, title, views, comments, average watch time, and view percentage time.
  • Facebook Page Insights: go from general to specific, analyze page metrics such as page reach, page engagements, positive actions, and total page followers. Also, understand the demographics: age and gender. 
    Get insights from post analysis: post image, post date, copy, post type, clicks, shares, engagements, reactions, and engagement rate.
  • Instagram Page Insights: are you growing your Instagram community? How is your engagement? Answer that questions with metrics like profile reach, account followers, post reach, post engagement, and engagement rate. 
    Also, get deep insights from the individual post-analysis visualizing the images, type, reach, saves, likes, comments, and the engagement rate of each one. 

Paid media data sources:

  • Google Ads: how are your Google Ads efforts influencing your most important KPIs? Answer that question understanding: impressions, clicks, cost, and conversions. Break it down by campaign and device. Also, get a deeper understanding of the keywords people use doing searches that drive clicks to your ads.
  • Facebook and Instagram Ads: visualize in a glance your most important KPIs:  amount spent, reach, clicks, conversions. Break down the data by campaign objective and demographics like device, age, and gender.
  • Linkedin Ads: analyze your B2B paid media results. Track your spend, impressions, follows, likes, clicks, and CTR. Get a deeper understanding of your lead generation campaigns and cost per lead.

Who’s it for

  • Agencies that want to track their clients results and performance marketing results.
  • Businesses with a complete content and paid media marketing strategy.
  • Marketing consultants assessing brands on digital marketing.

Questions?

These are metrics associated with this overview:

This report template is really for free, and you can copy it and use it whenever you want. However, you need to pull your data from the Porter Metrics.

Once you have successfully created a copy for this template, you will start a 14-days free trial with us. Also, you will choose a paid plan to upgrade your porter metric account and keep the connector working. 

Note: If you don't want to upgrade a plan with Porter, you may keep with the template, but the connectors will stop working, which means your data won't be available in this stunning and comprehensive template.

When you have a custom report template, you can visualize real-time charts and know your performance when you have a custom report template.

Once you have set up your advertising report template, you will follow these steps to analyze your data:

  1. Define a goal: to analyze your SM strategy campaigns performance; you should compare your KPIs against a goal to have a context. To set up your goals, you may consider metrics such as ROAS, CAC, and CPL as they're a measure of the impact on your business. 
  1. Break down your data: to identify where your metrics are underperforming, break them down by dates, campaigns, regions, ads, devices, etc. With more than +100 breakdown options, SM will help you spot where ad spend is wasted.
  1. Map a funnel: funnels describe purchase journeys so you can spot where your audience gets stuck. We've got a funnel report template for that.


You can customize your report by creating new charts, adding filters and controls, custom formulas, colors, logos, and changing the size of your canvas.

We have created the following video tutorial to show you all these options to customize your SM report template: How to customize a Google Data Studio report

As we have shown you, Porter Metrics has been created as a non-code platform for marketers and agencies to automate your Data Studio reports in some minutes. 

The difference between Porter Metrics and competitors is the non-code and the resources that Porter Metrics offers. You can also review this reporting tools list to know all the solutions available, including Porter Metrics and competitors. 

Please make a copy of this funnel report template and use it now to track your campaigns. As we show you, these are the steps:

  • Login with Google
  • Connect with your APP
  • Choose your ad accounts
  • Set up the conversion window and reporting time

Remember, if you need help to set up your report or star tour free trial, you can schedule a call, and we will be happy to help you.

Make your 1st report in a minute

Porter is the fastest way to get your marketing metrics and dashboards where you need them