Social Media template: Facebook and Instagram Insights for Google Data Studio
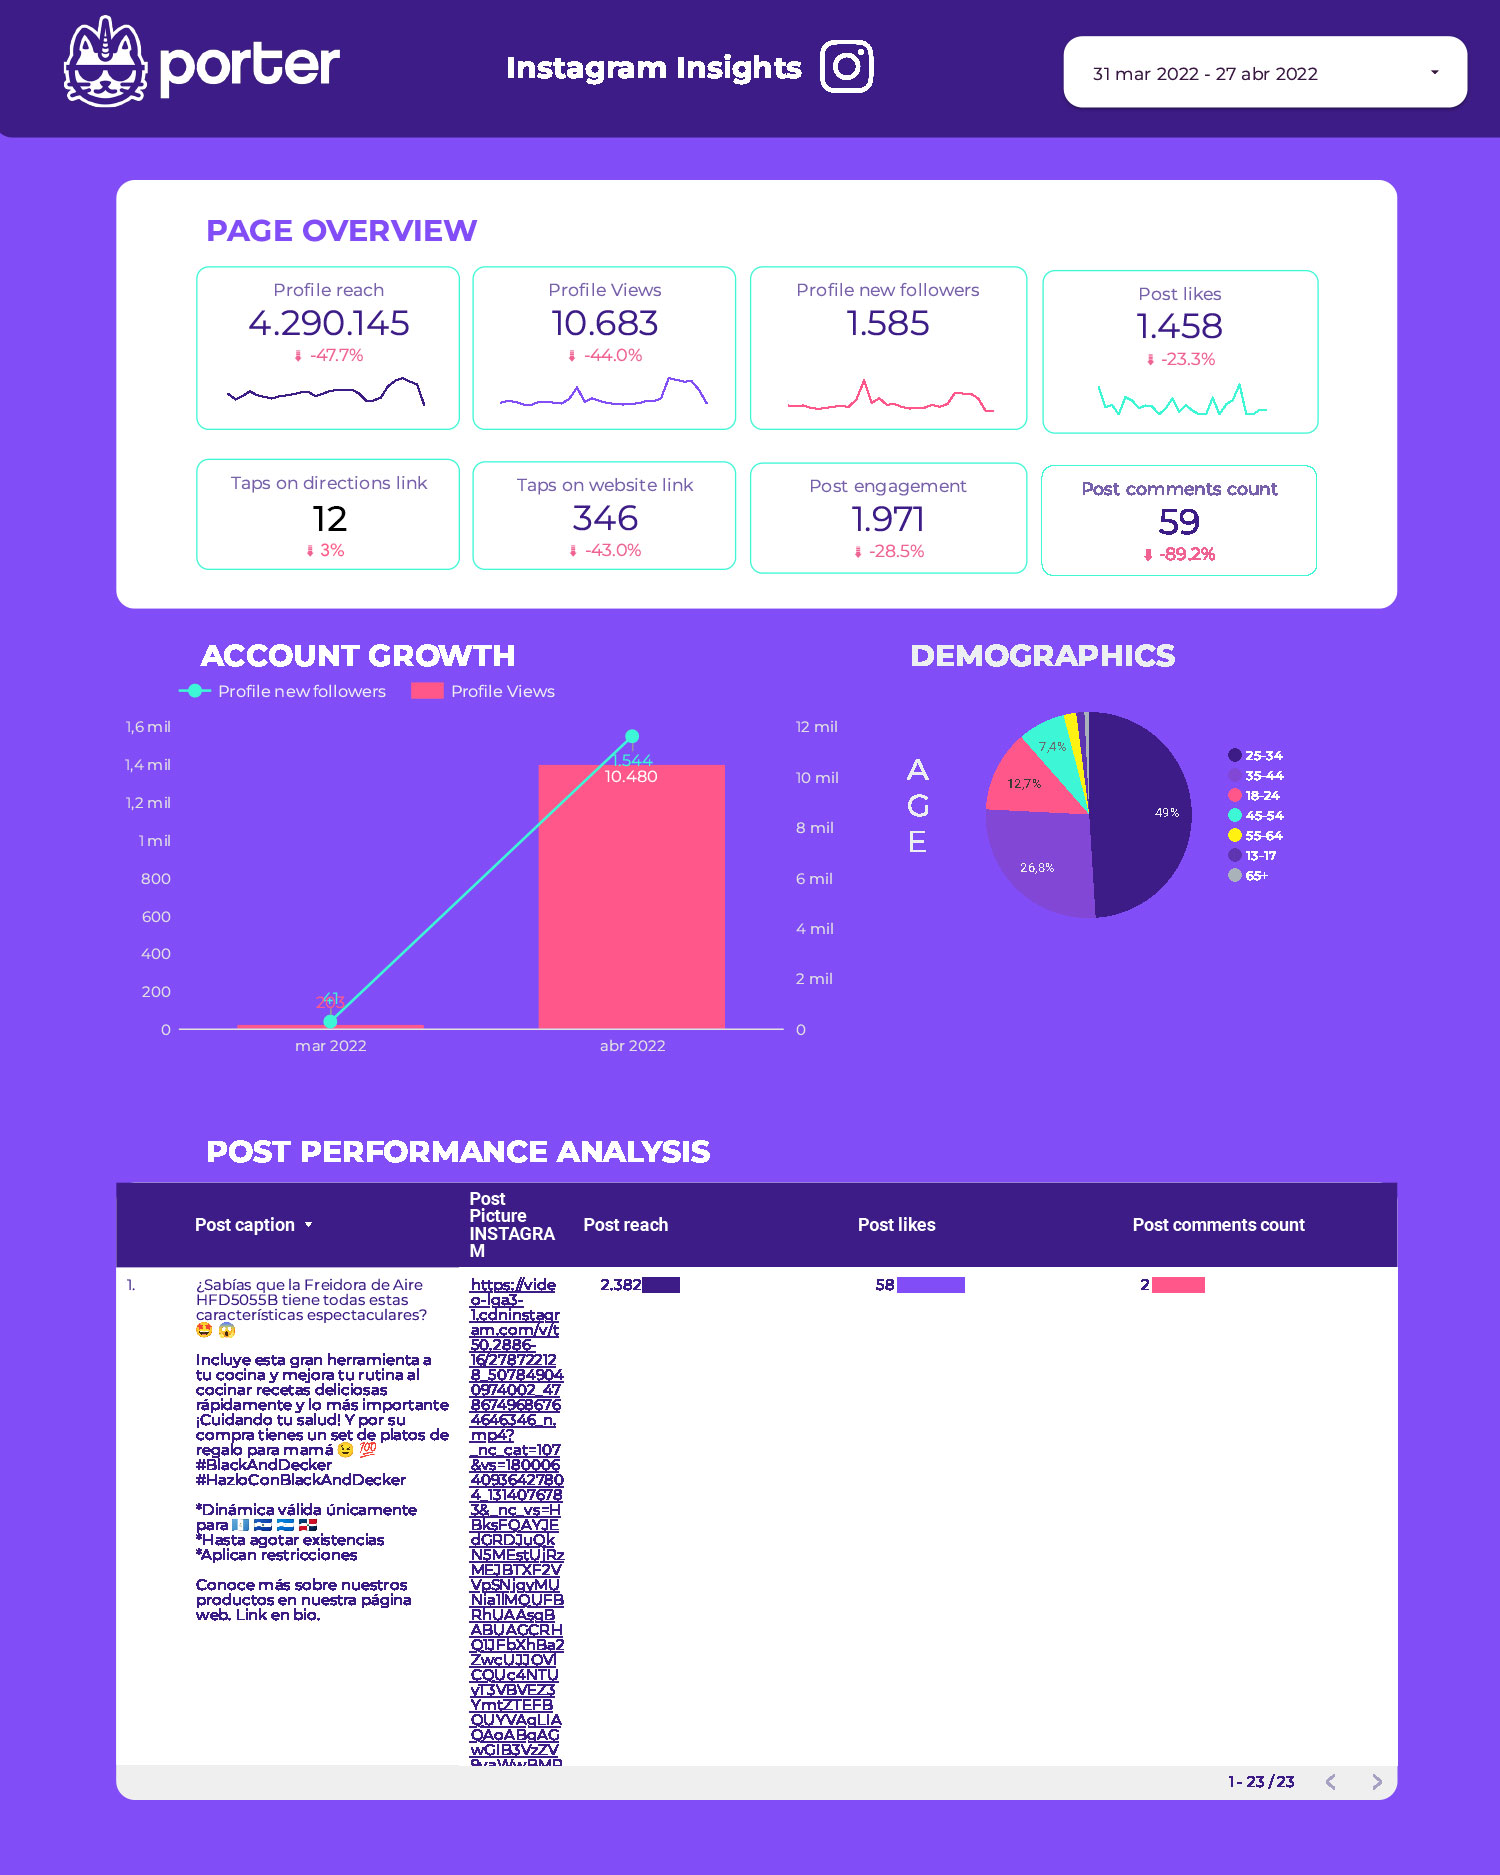
Visualize your Facebook Insights and Instagram Insights performance. Understand what’s driving your page growth, your best posts and your audience.
Visualize your Facebook Insights and Instagram Insights performance. Understand what’s driving your page growth, your best posts and your audience.
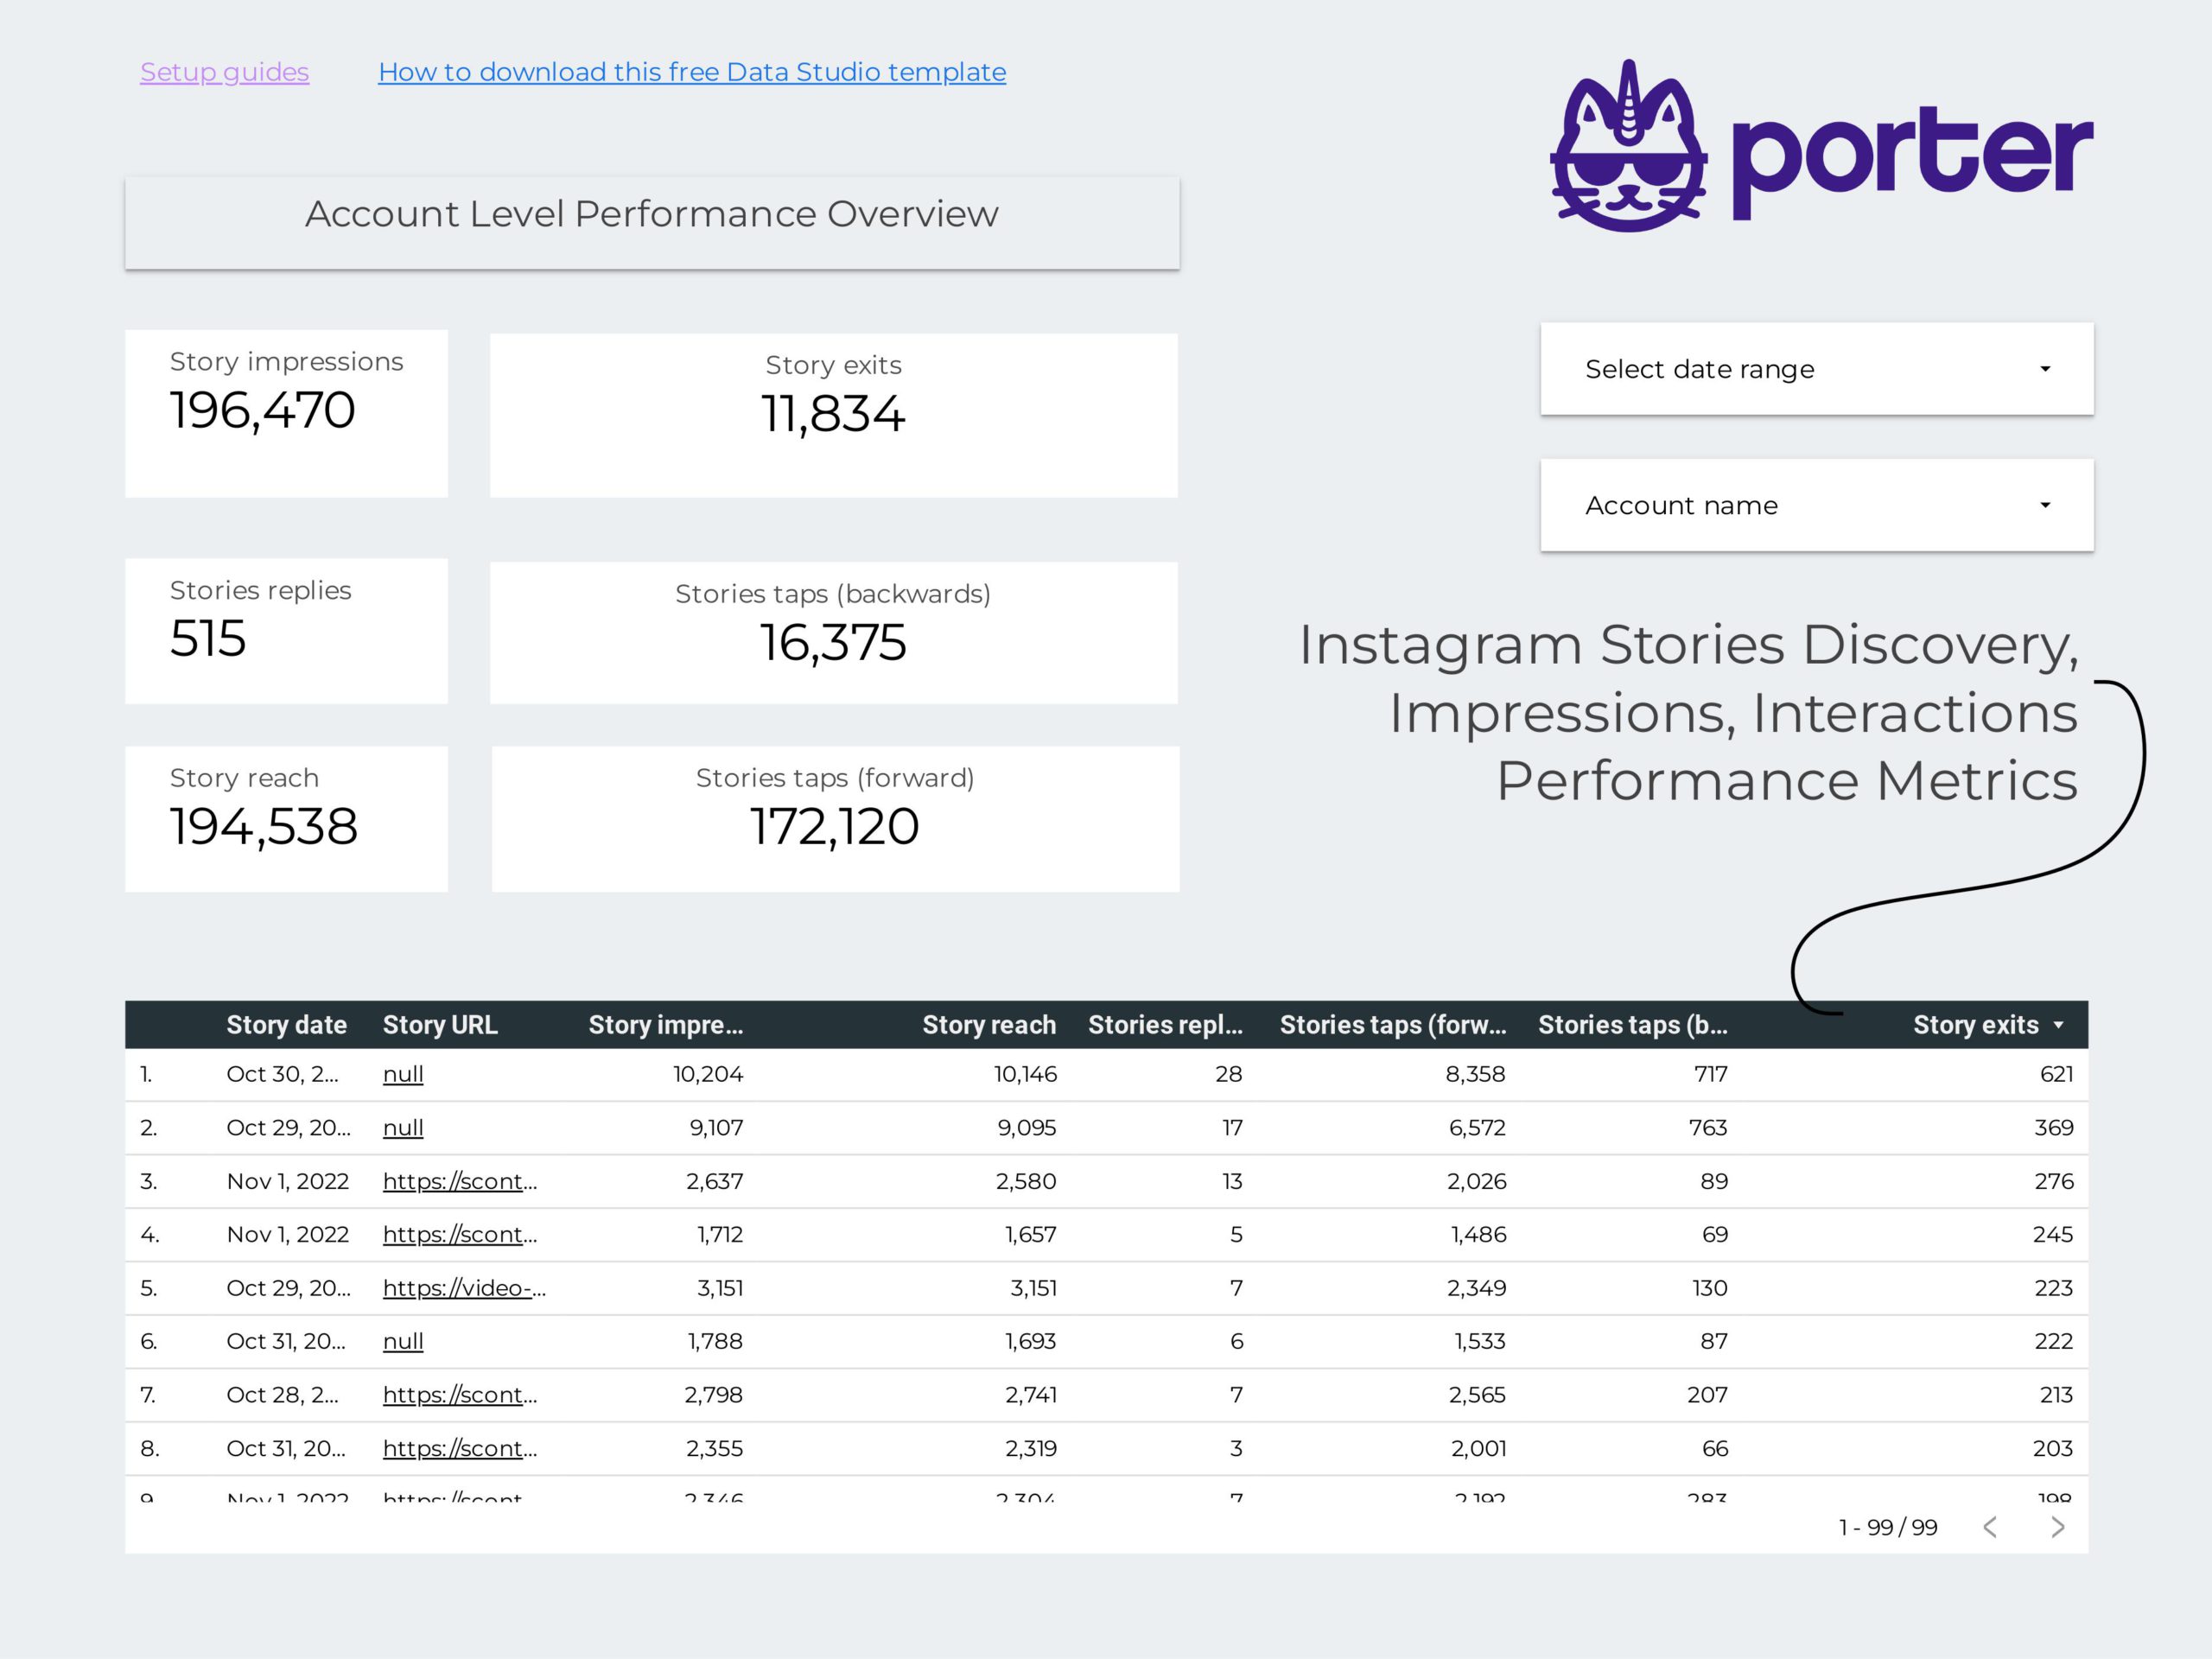
You can now visualise the performance of your Instagram Stories over time without having to take screenshots which was not possible due to API limitations.
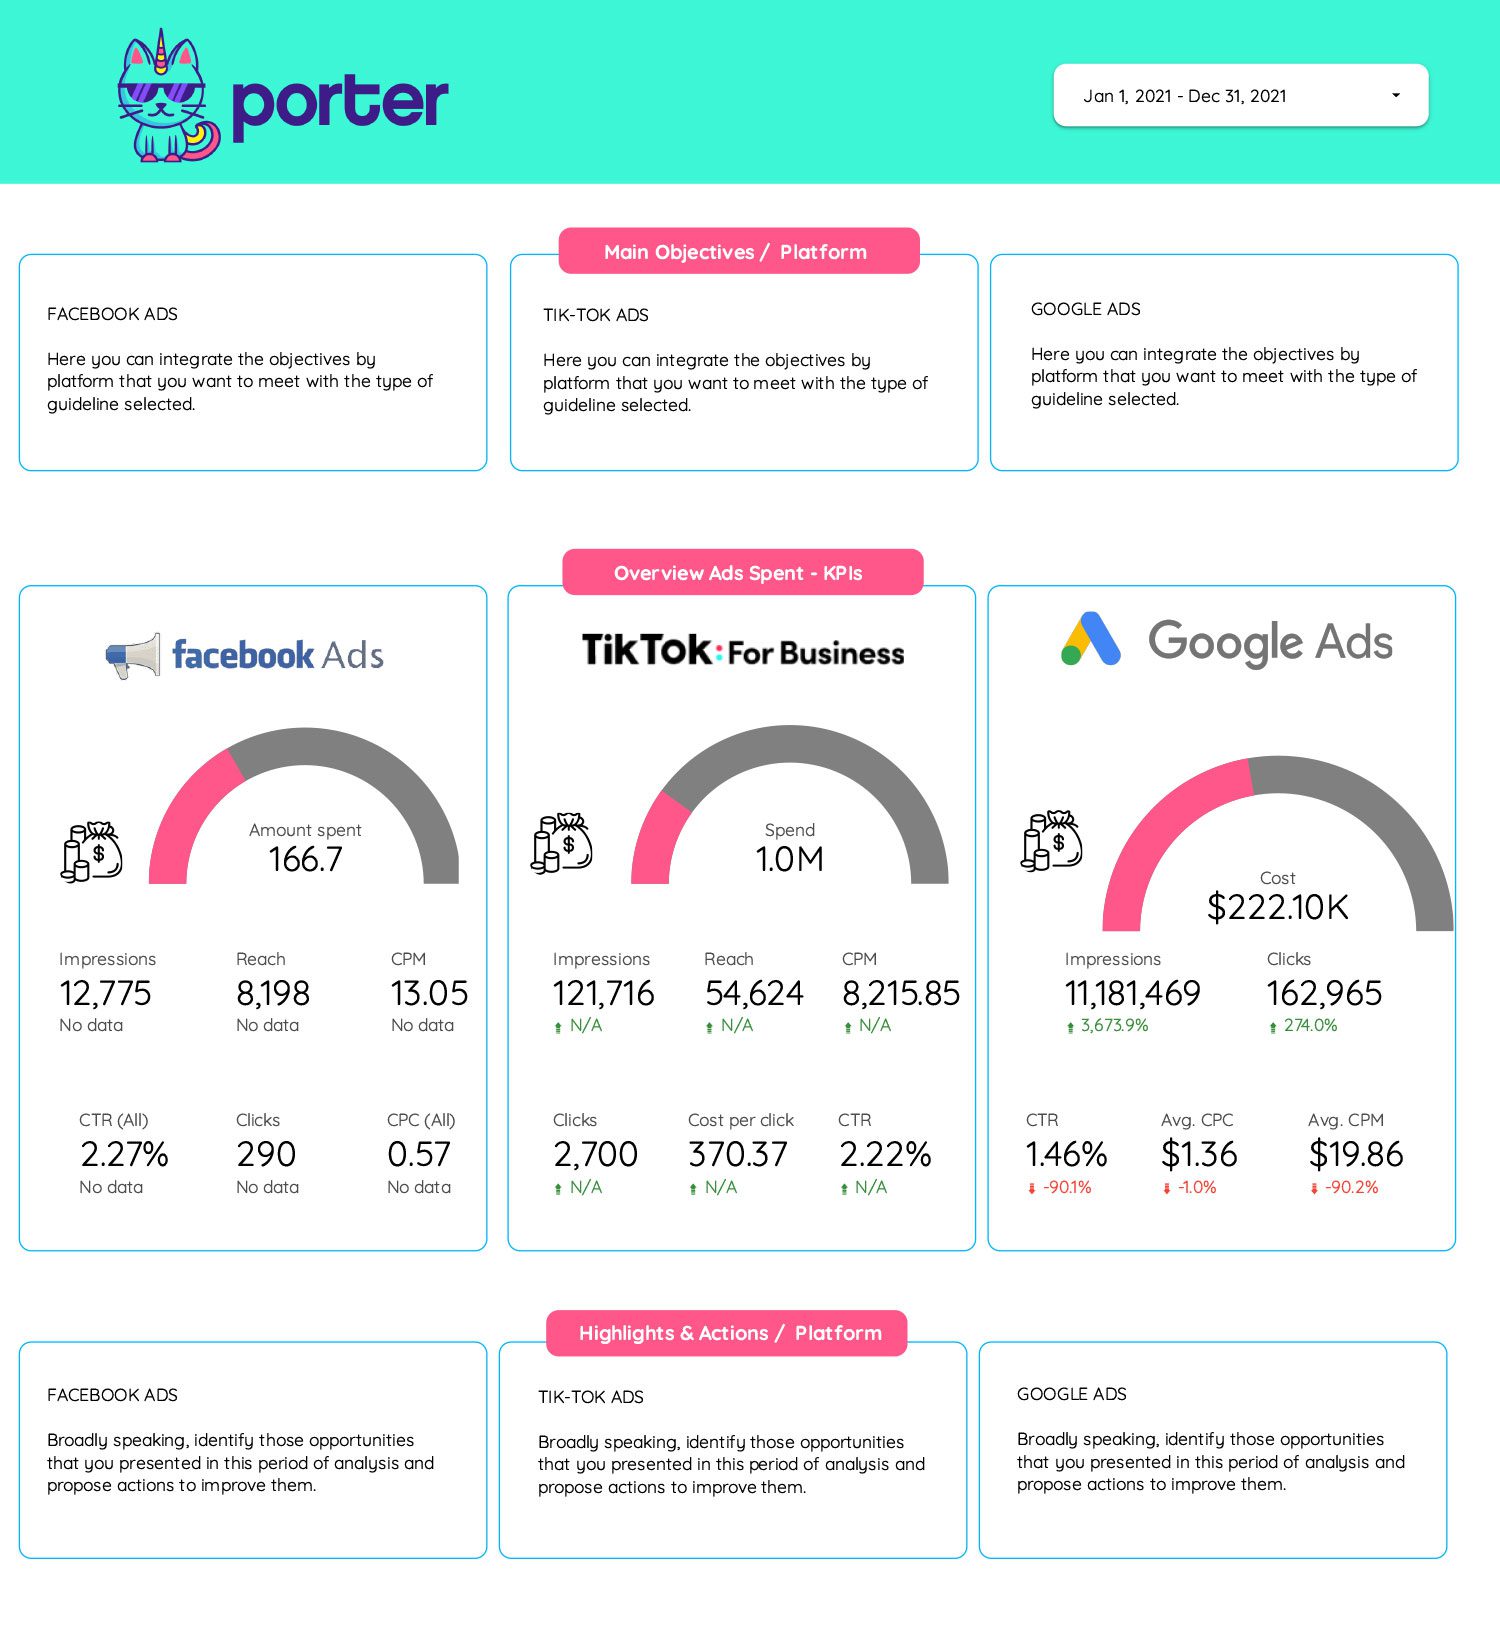
The PPC report will help marketers understand how Pay-Per-Click campaigns are performing. Download it for FREE.
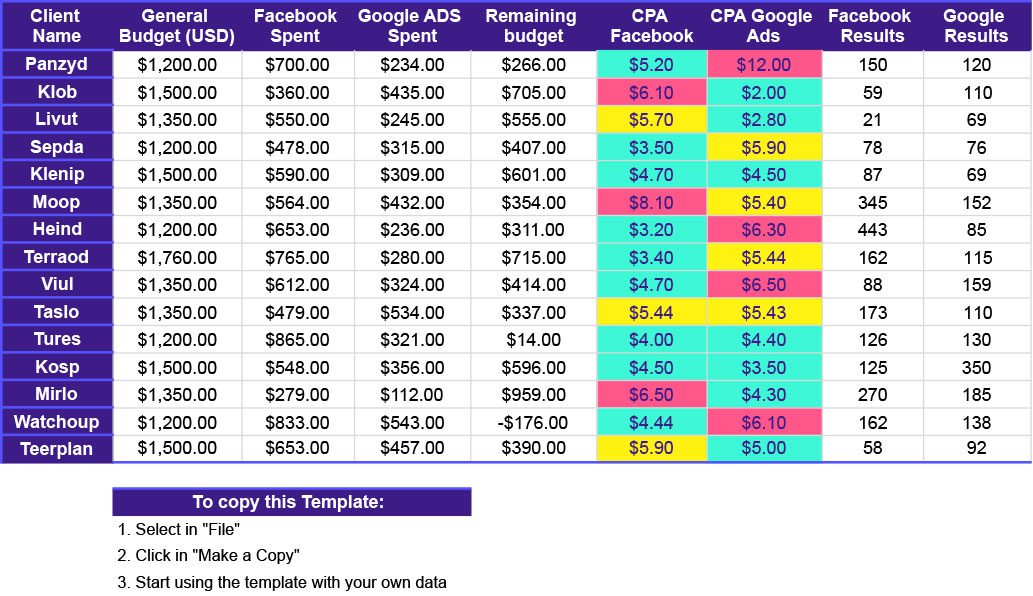
Track all your clients’ performance at a glance with this Google Sheets template. Keep high-performing clients happy; optimize under-performers on time.
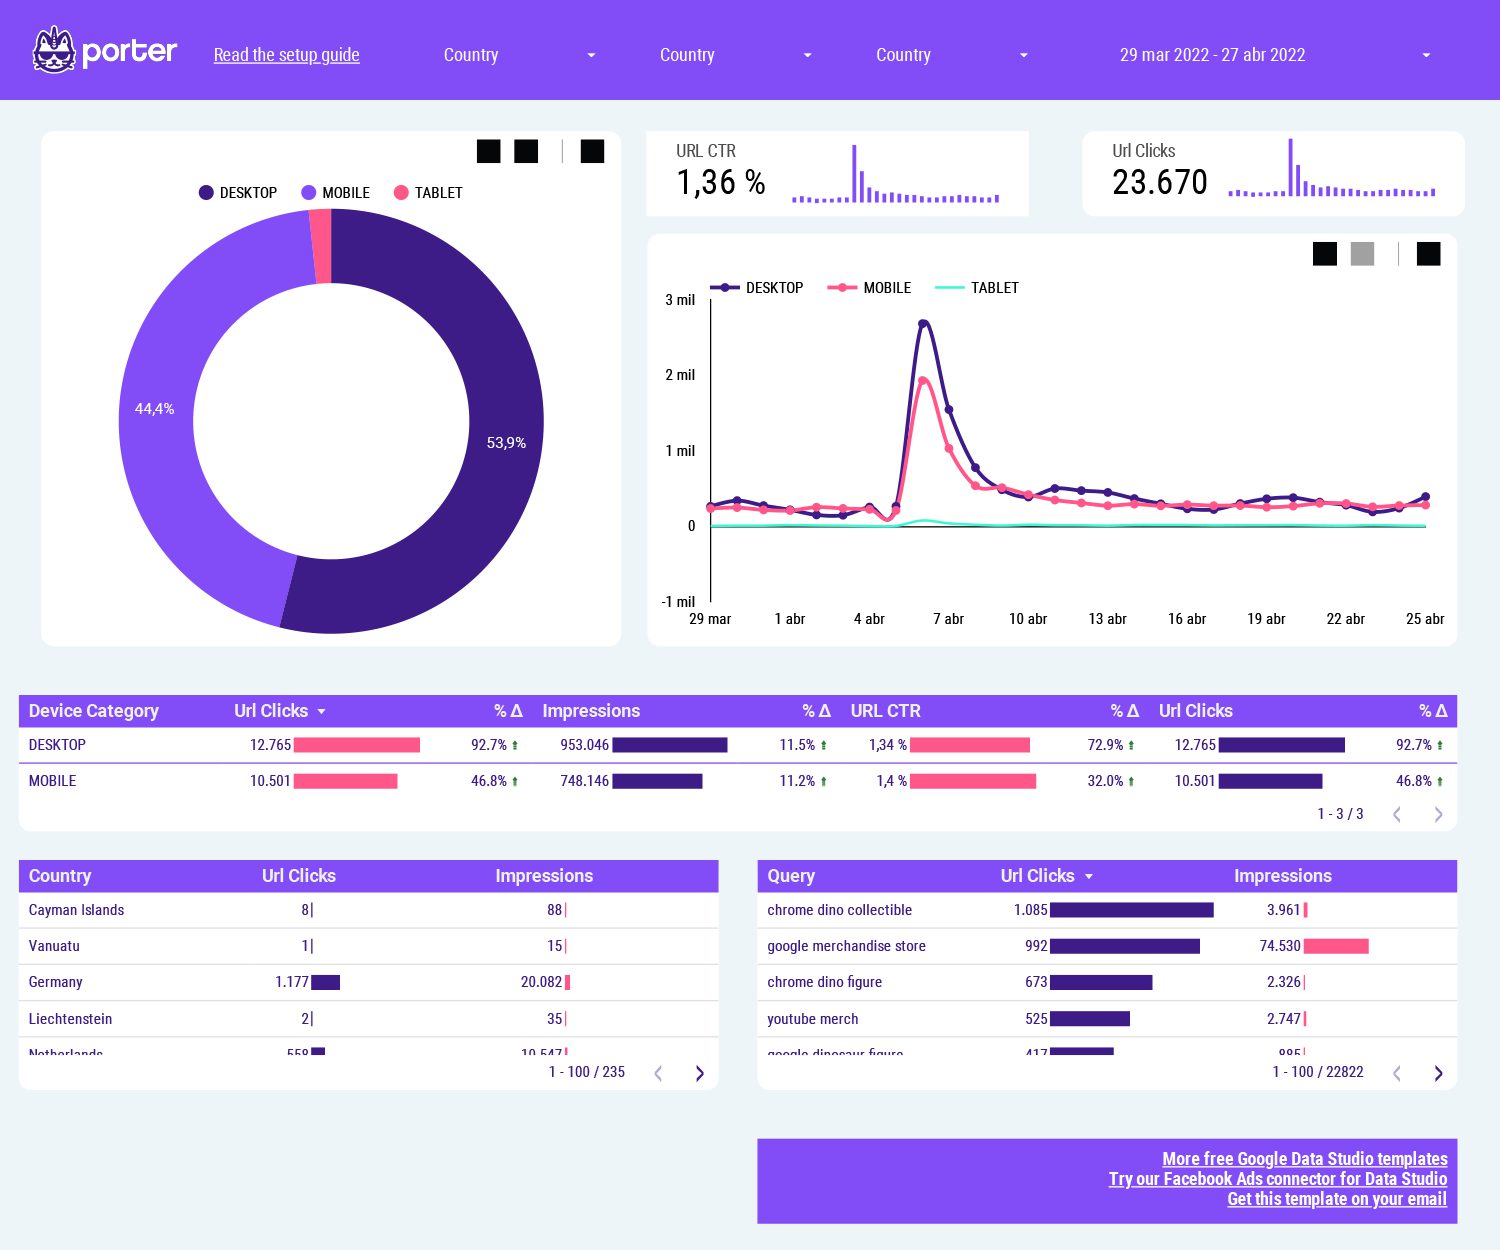
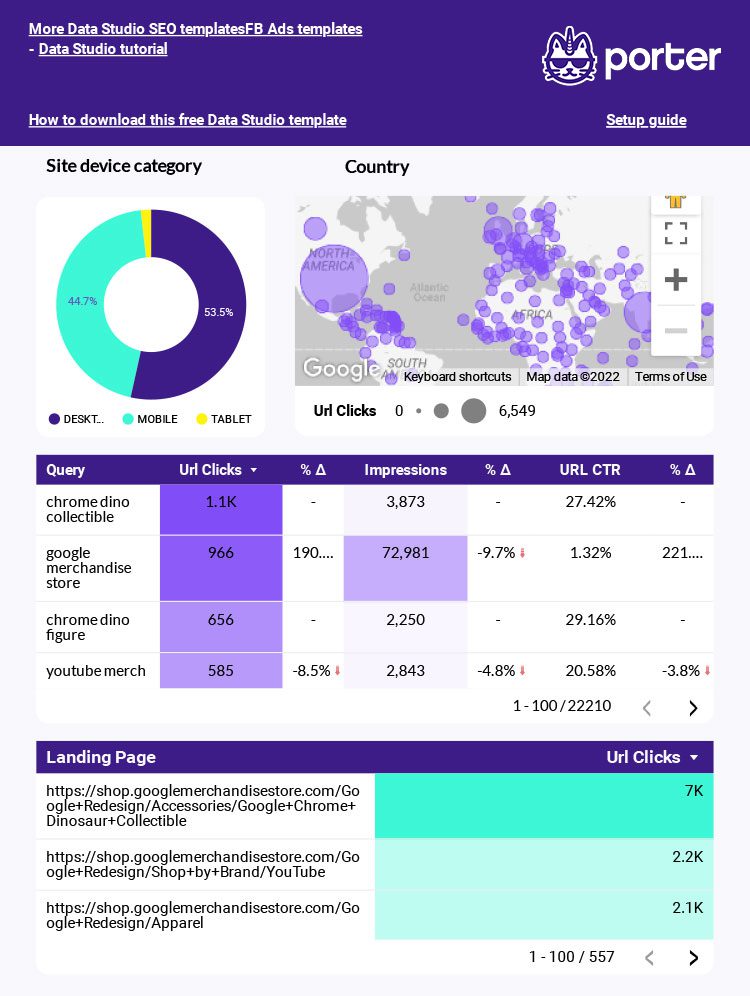
Learn to break down your SEO analysis into branded and non-branded (or discovery) searches
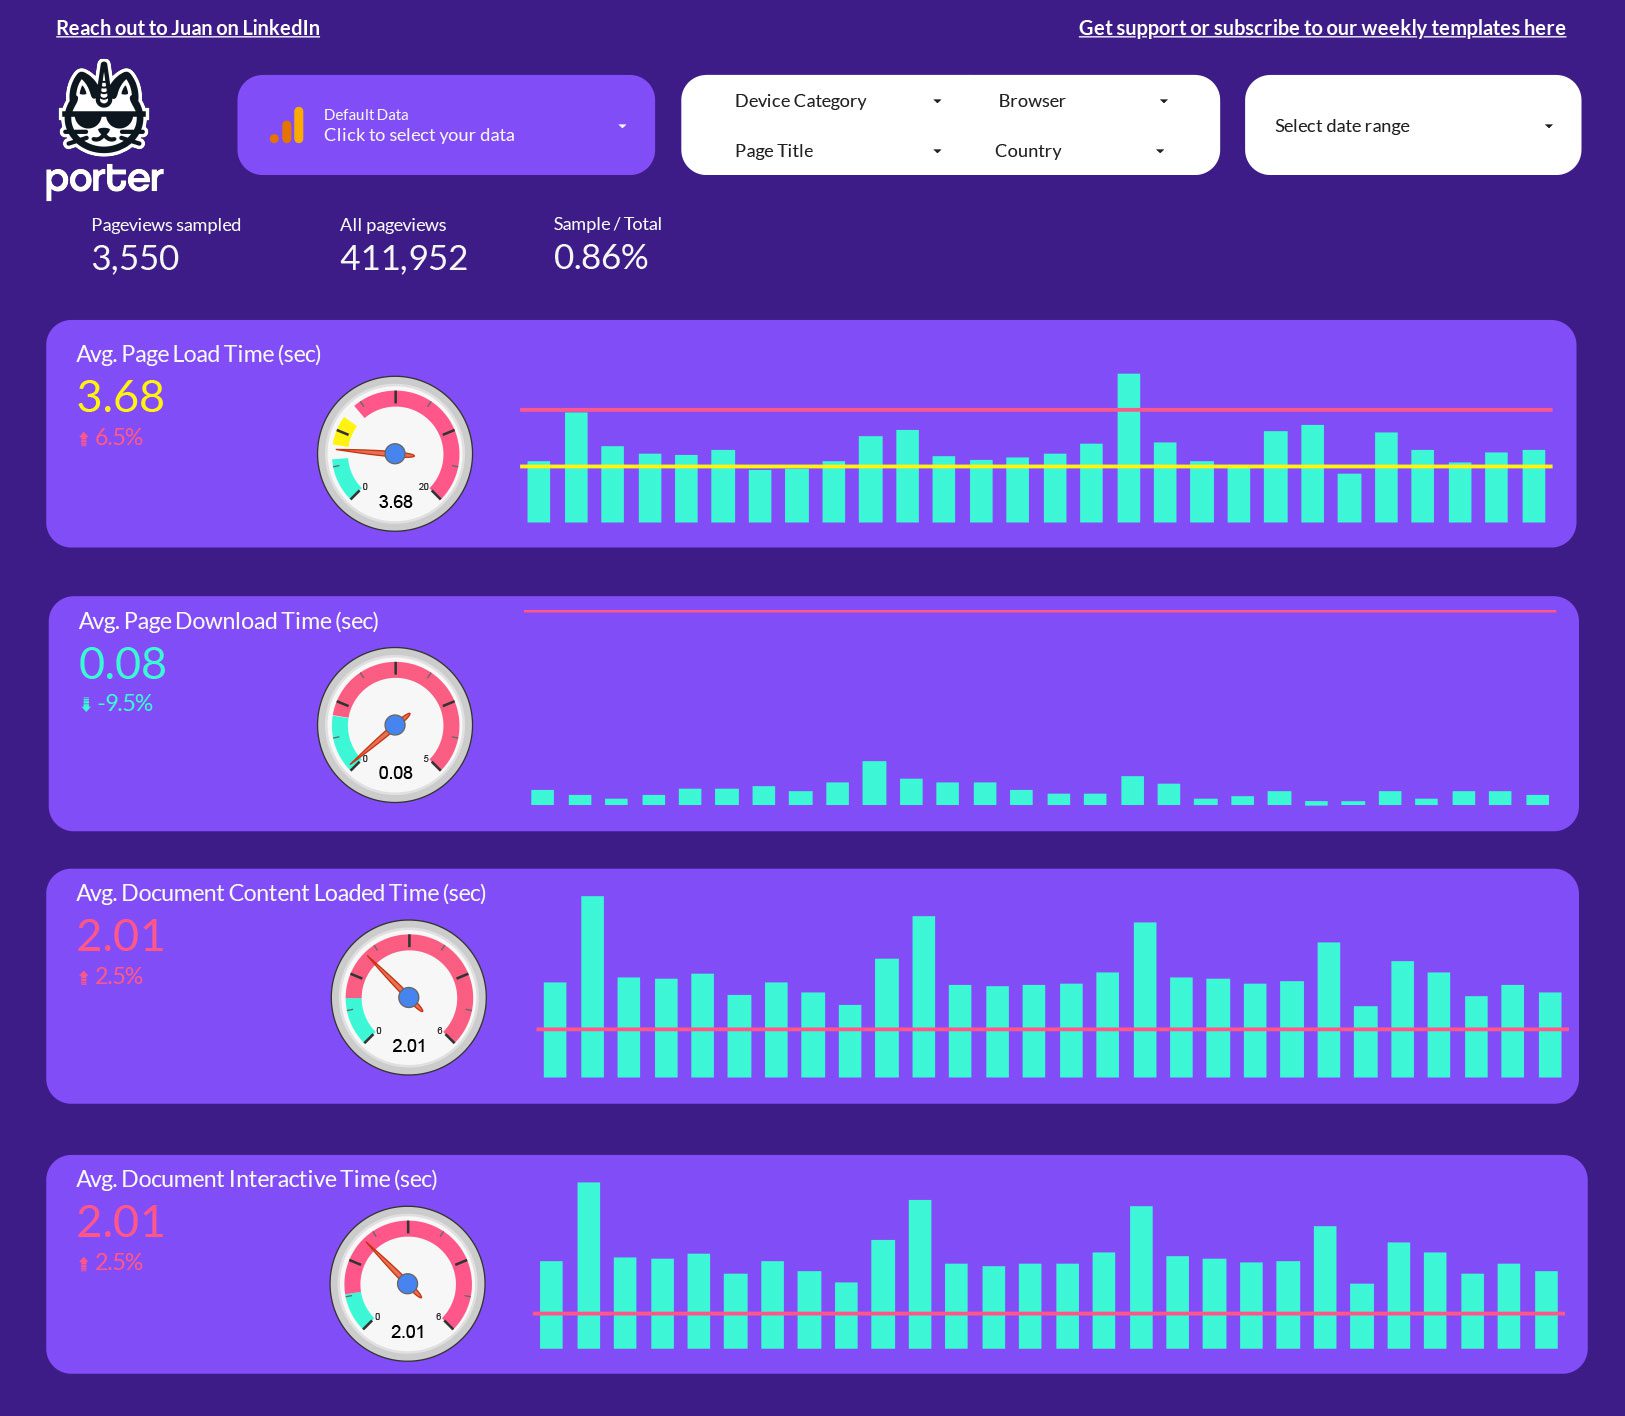
Our free report template will be your favorite tool to test your website speed. Track your website speed performance at a granular level with Google Analytics. Break down data by page, country, devices, and broswer.
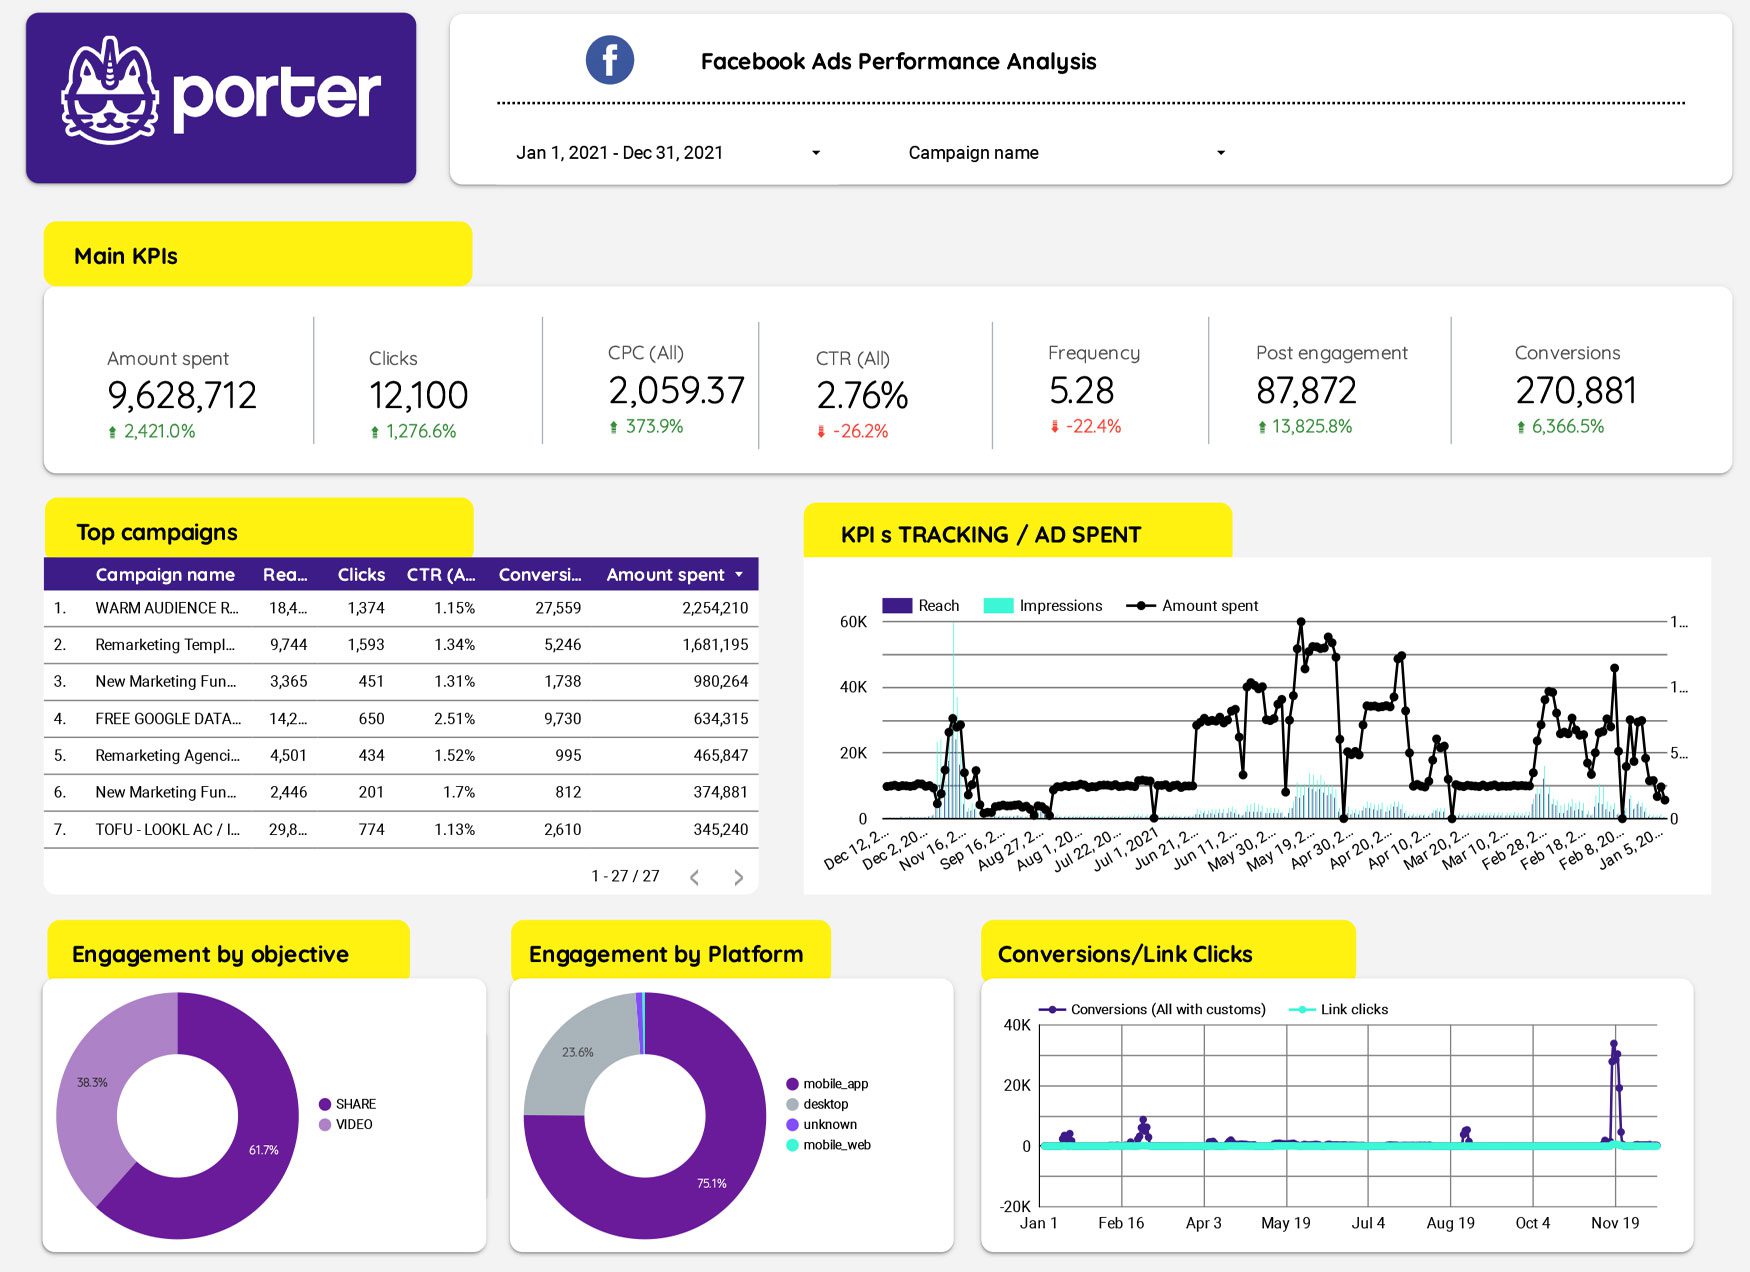
We created a free analytics report template to help you analyze and better understand your account. Simply connect your Facebook Ads account to Google Data Studio, and the template will do the rest!
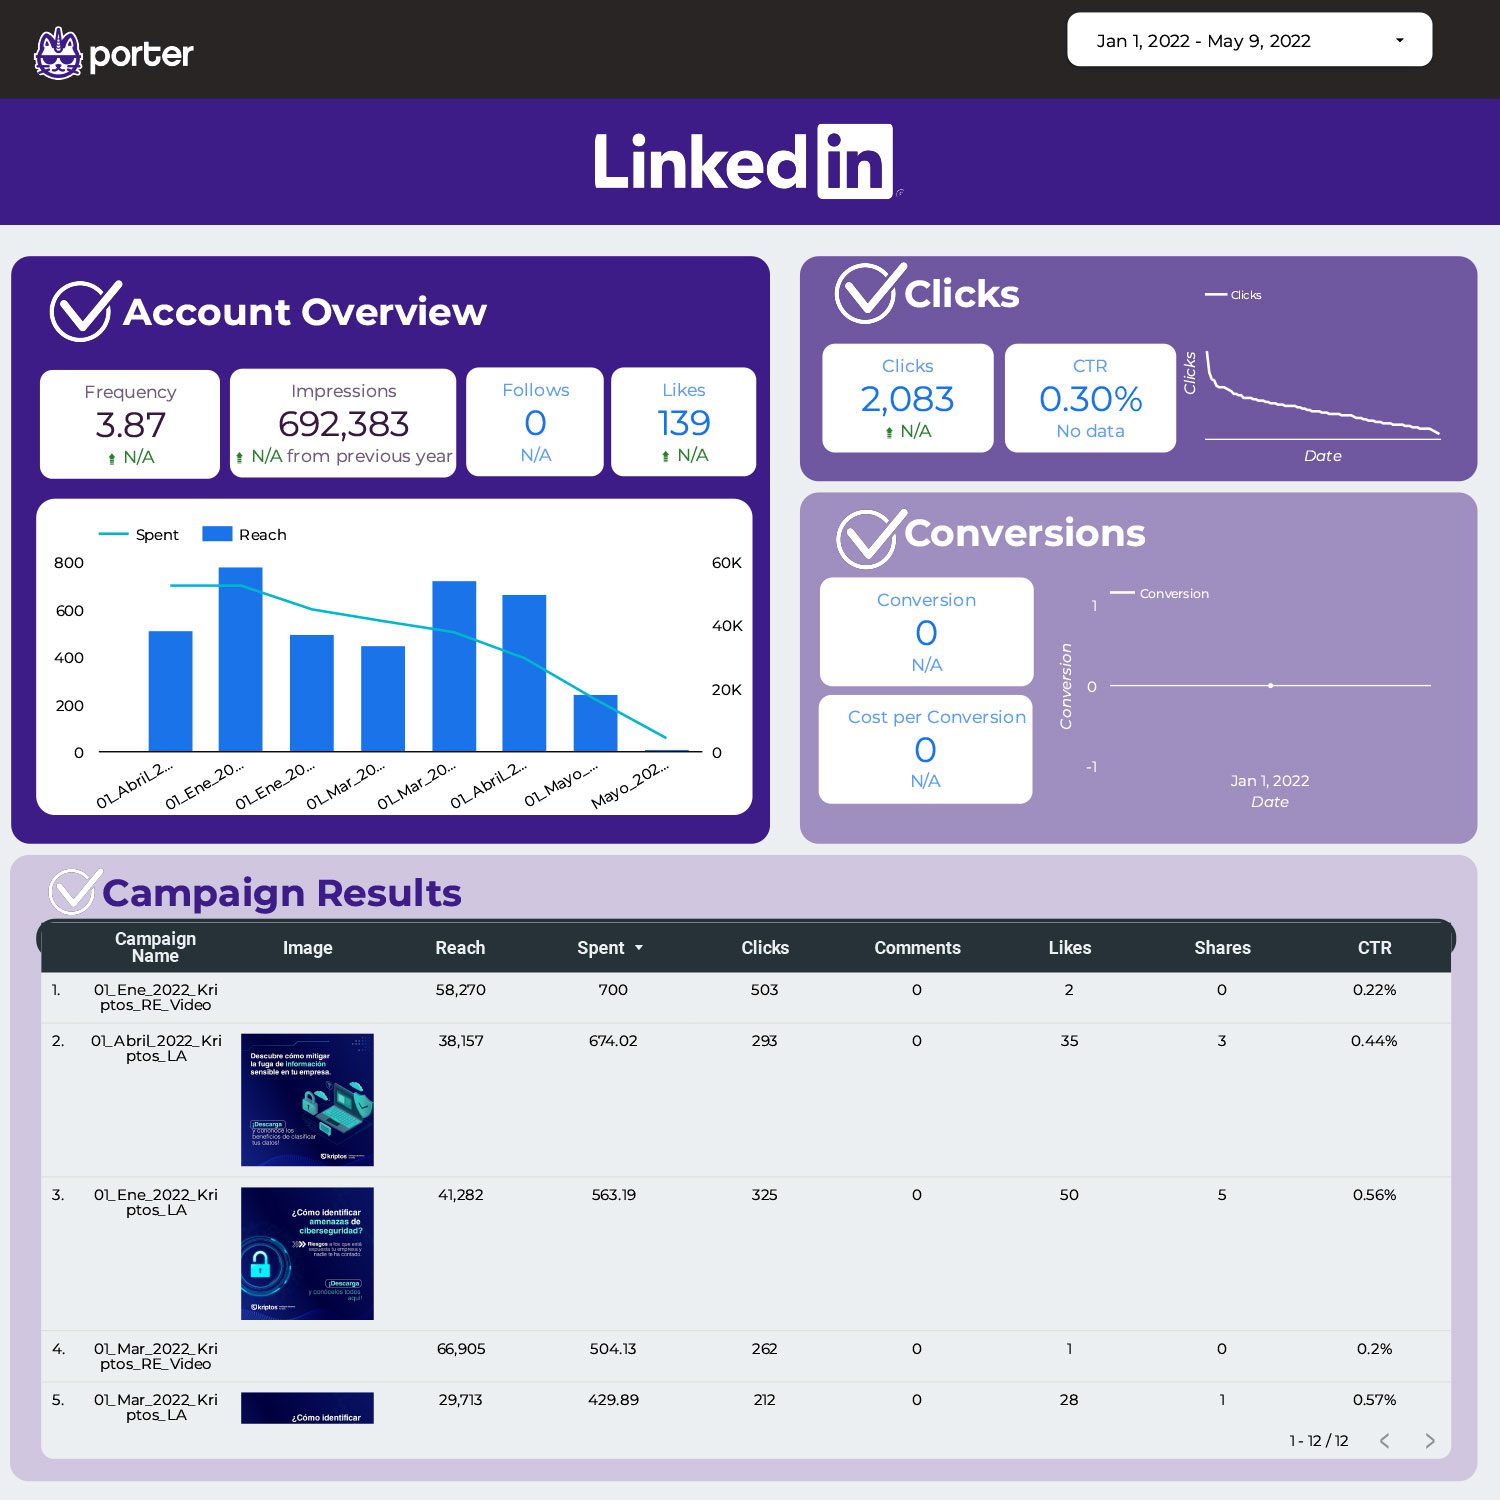
With more than 200 fields automate your LinkdIn Ads report, track your most important KPIs, compare different periods and break down your campaigns as you want.
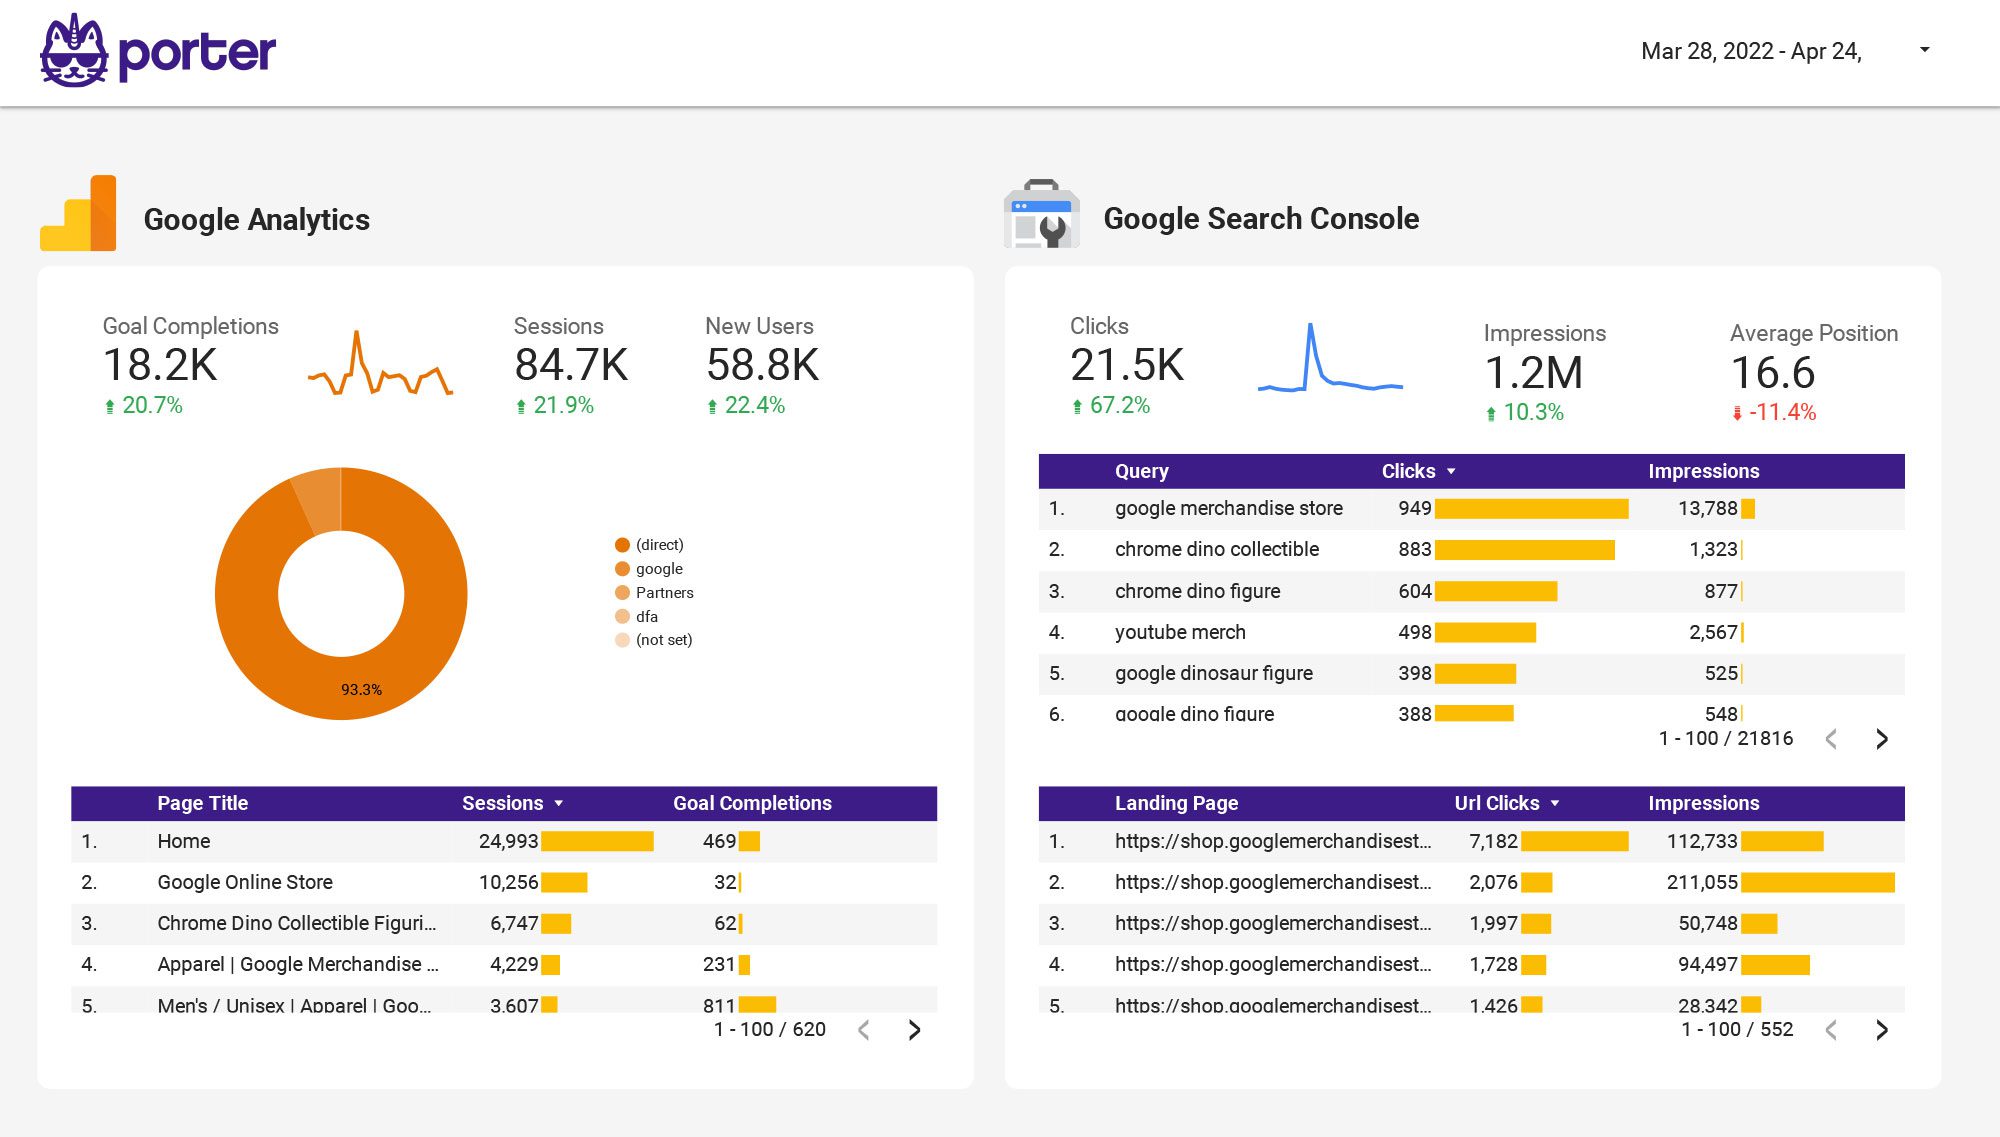
Visualize your core marketing KPIs from all channels in a single view: Google Analytics, Google Ads, Youtube, Google Search Console, Facebook pages, Instagram pages, and Facebook Ads.
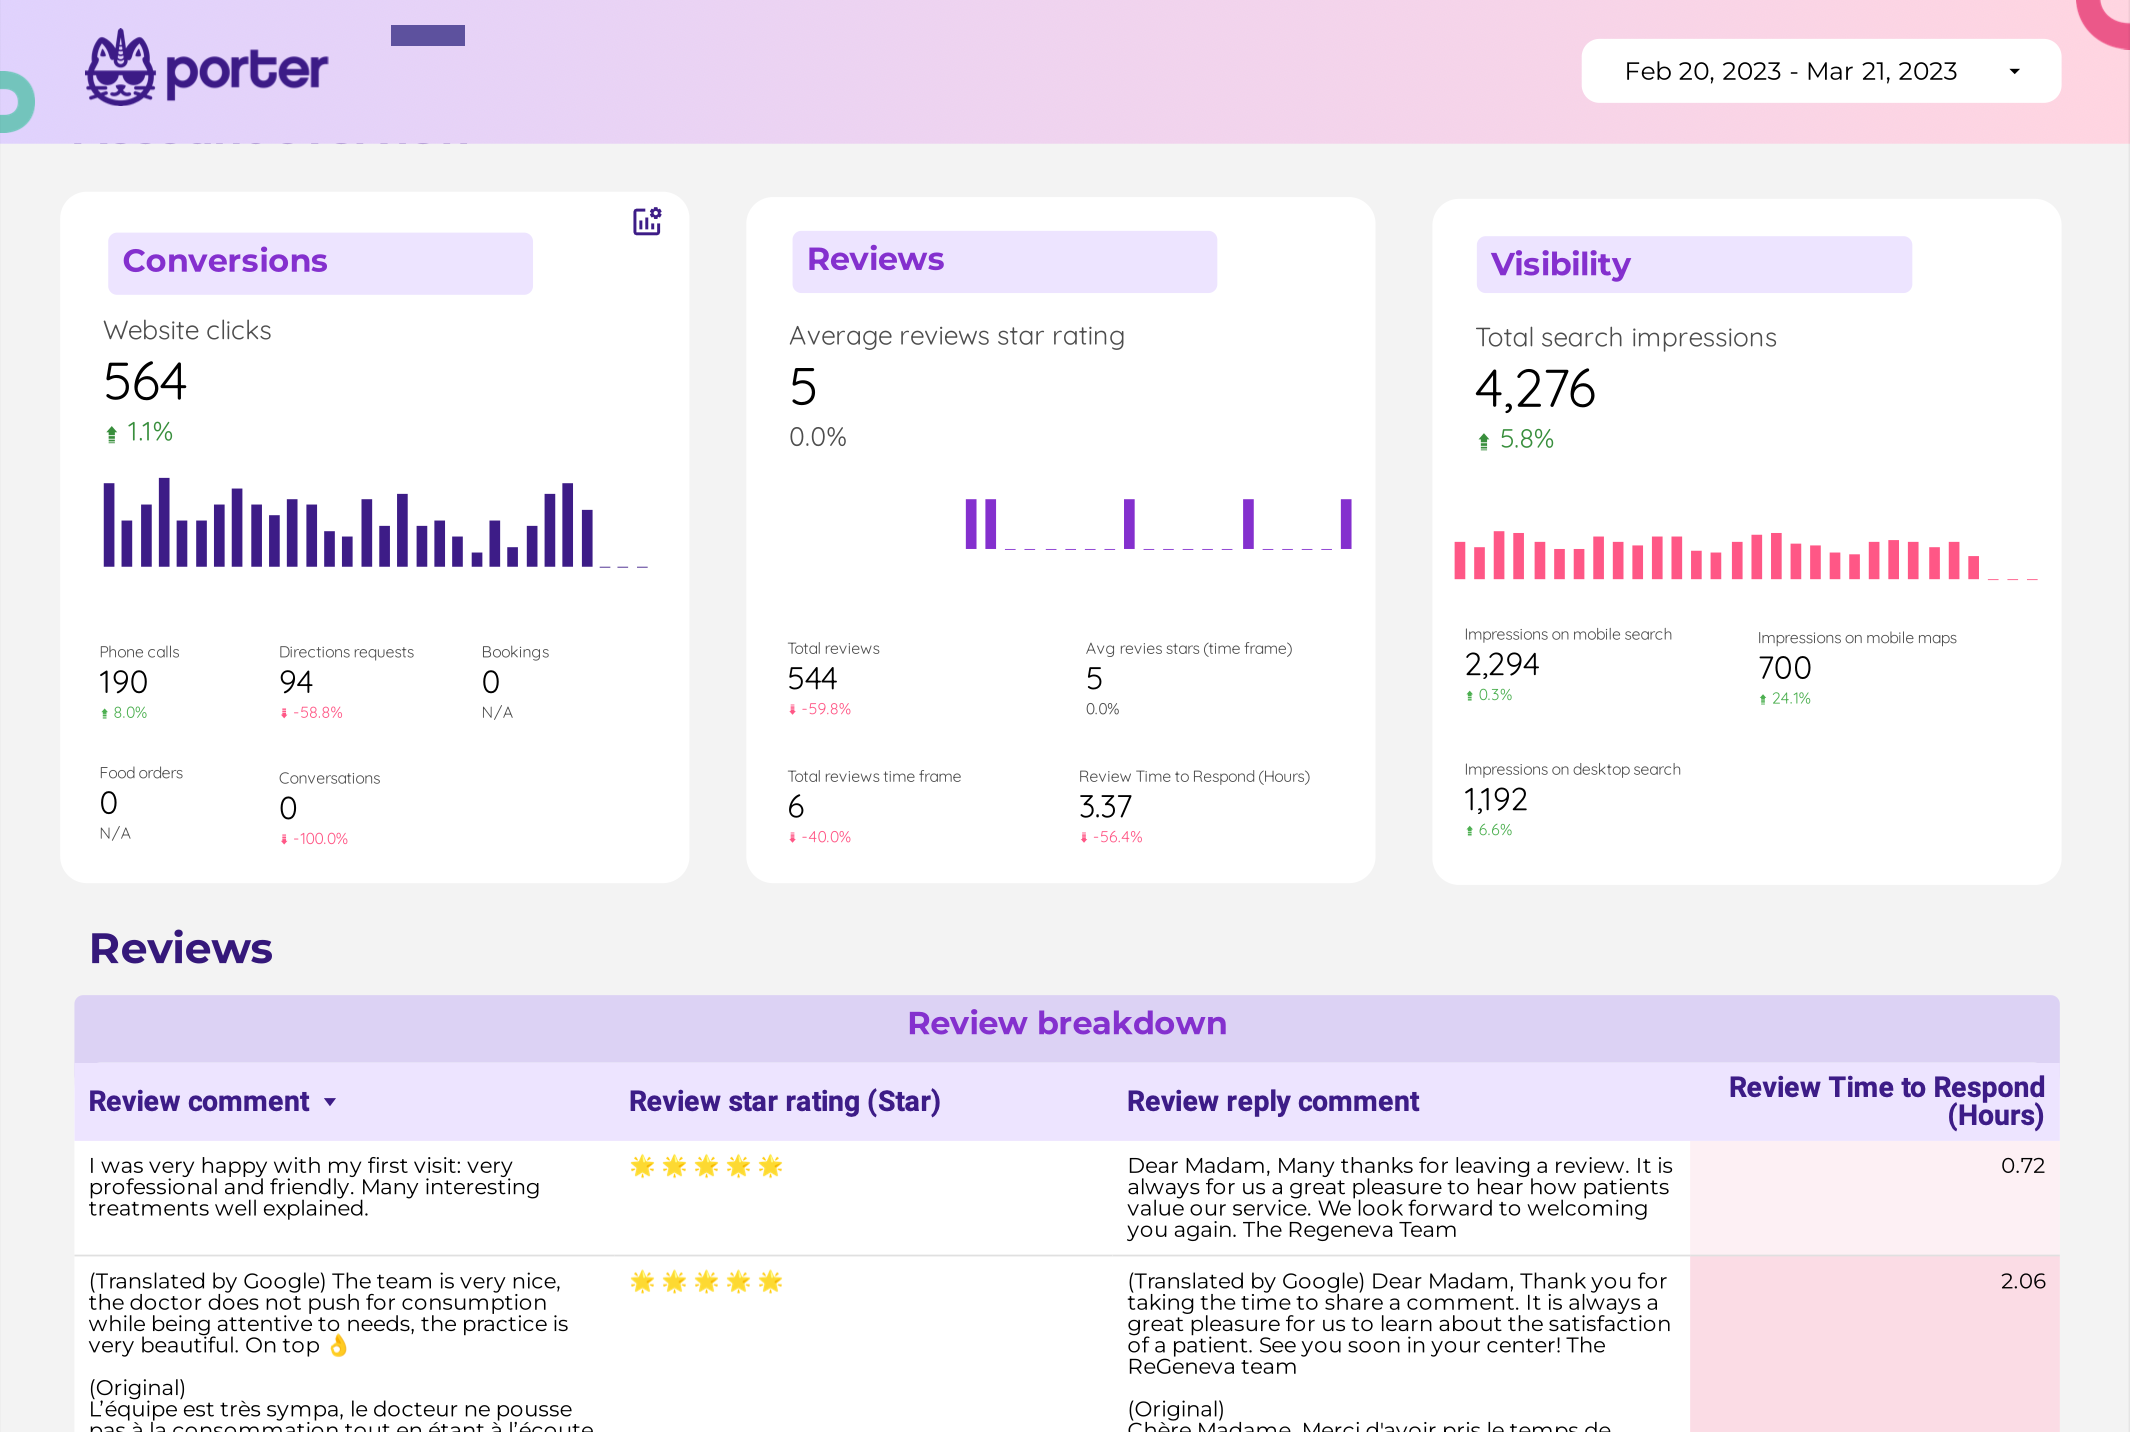
Visualize information in a comprehensive dashboard you can use to get more 5 stars rates. This free report was made for business owners, local business consultants, or SEO agencies.
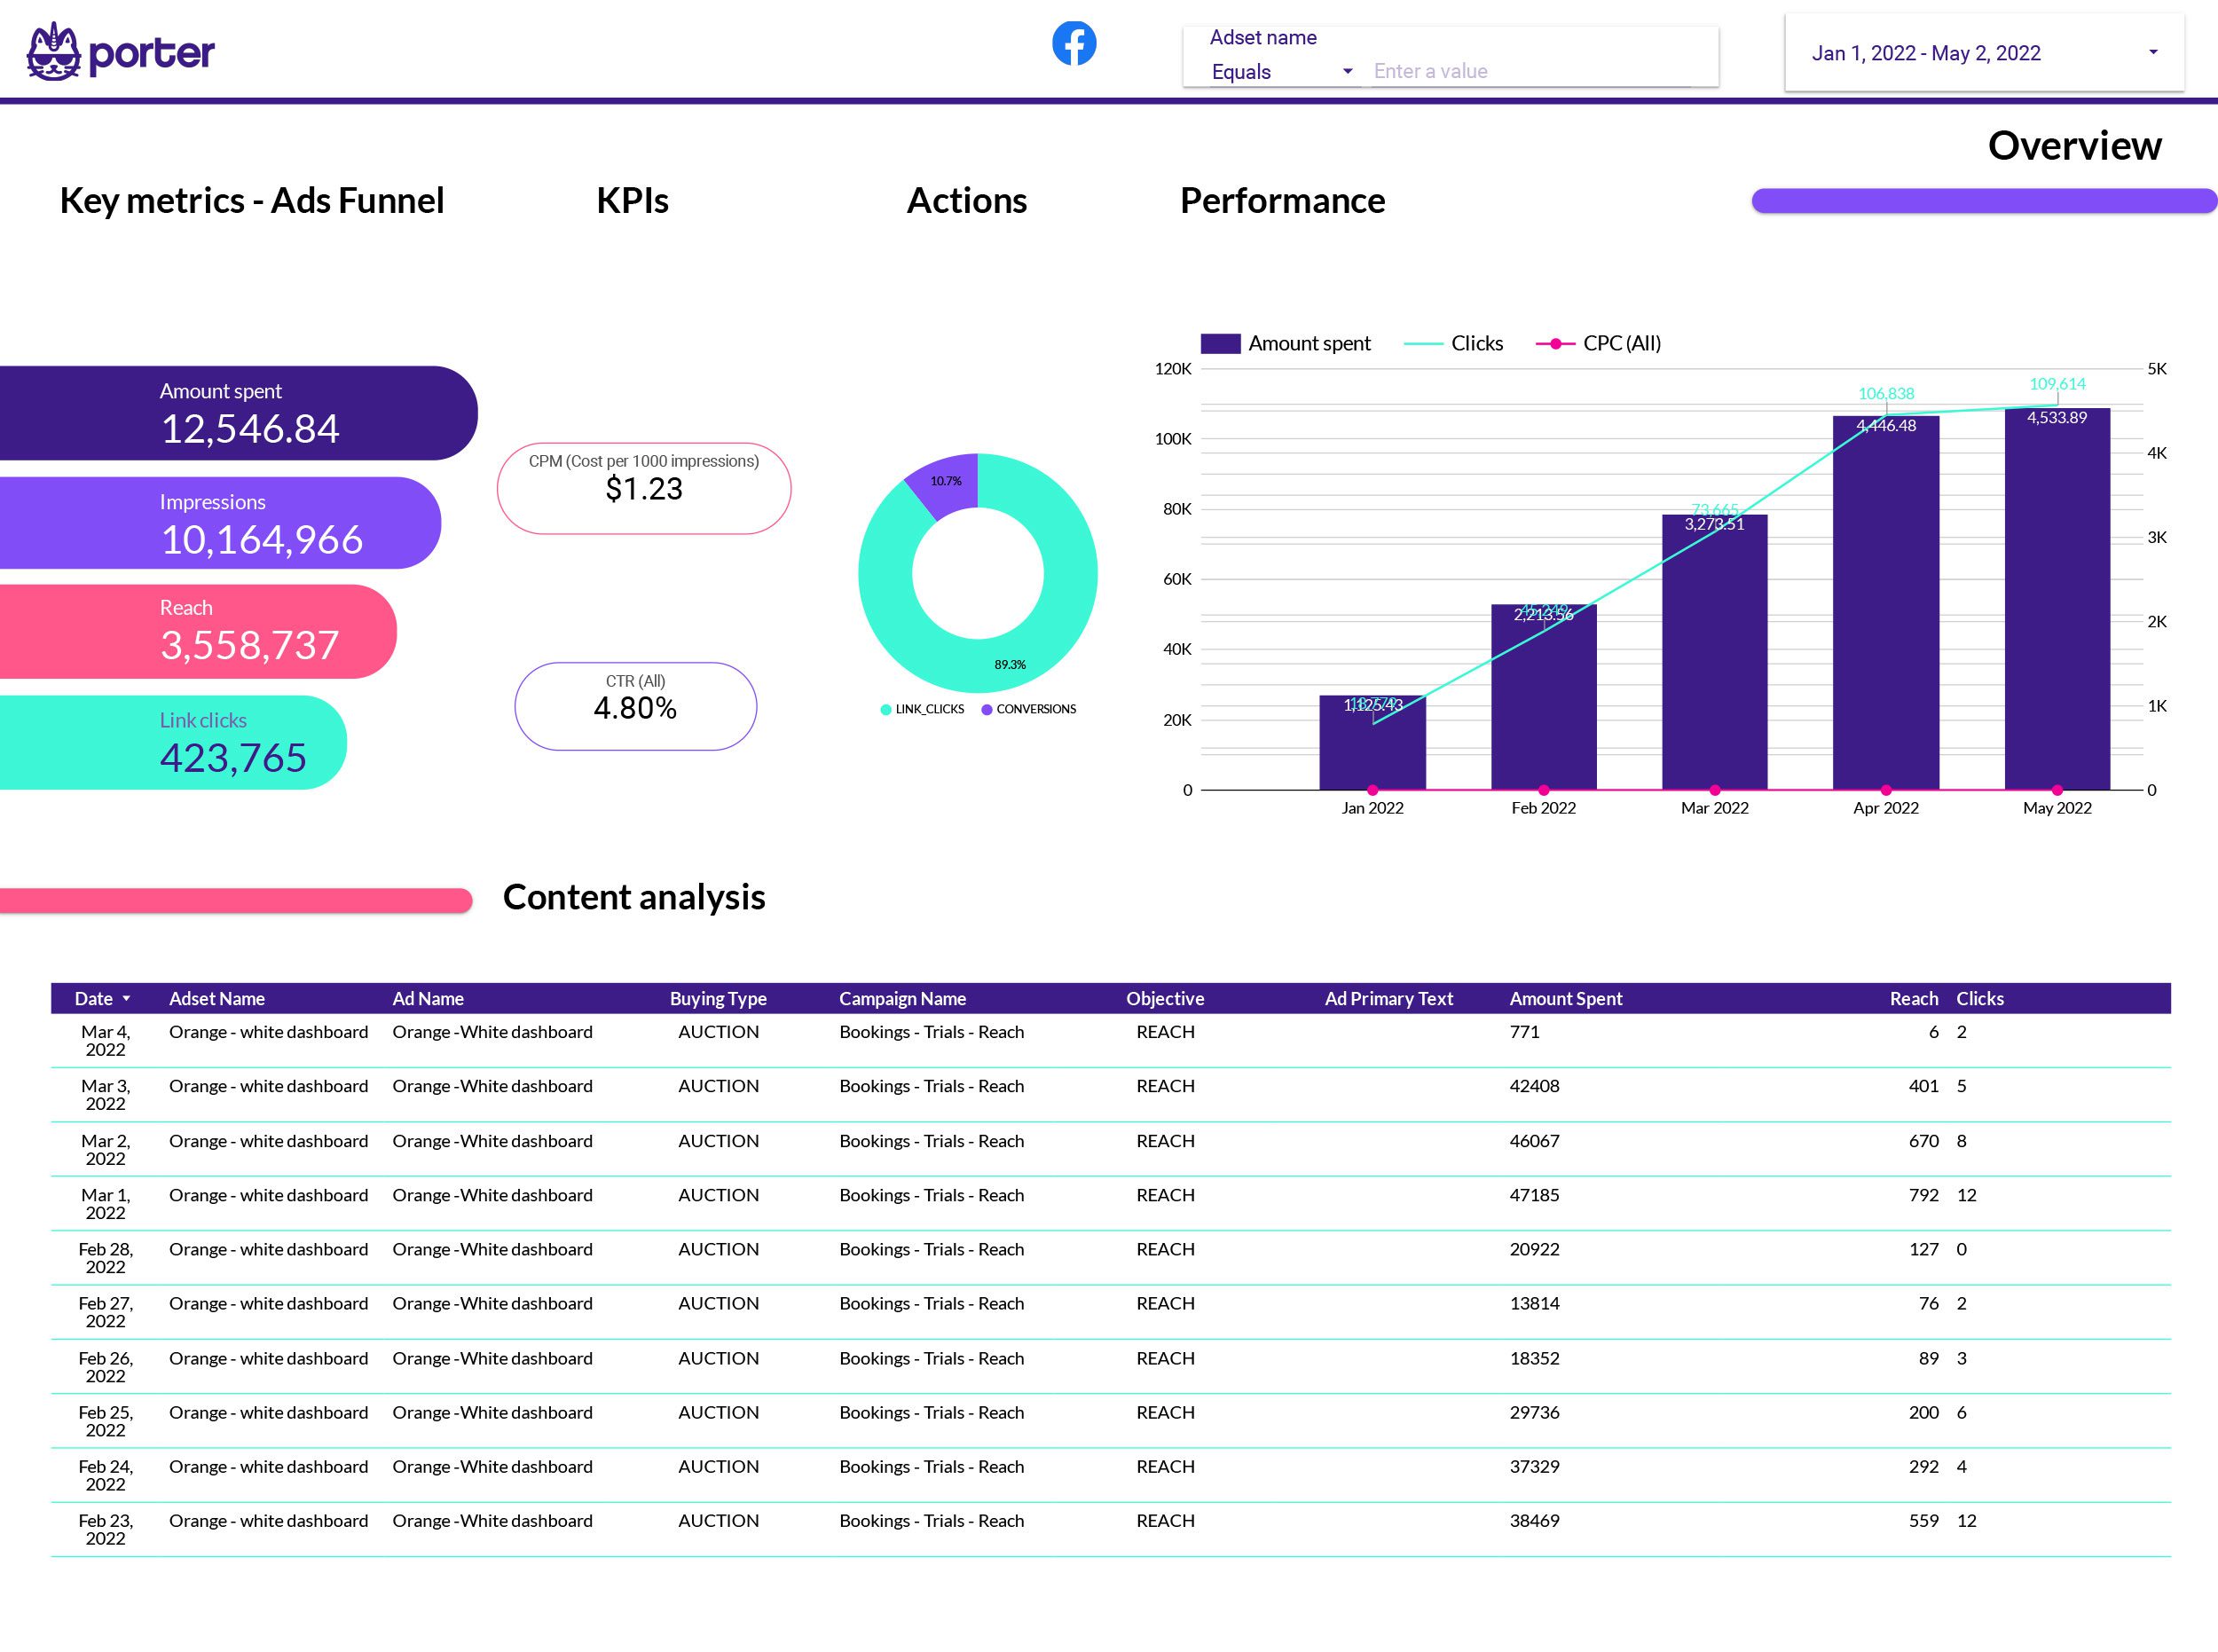
Facebook has various campaign objectives which allow you connect with the right audiences at different stages of the marketing funnel.
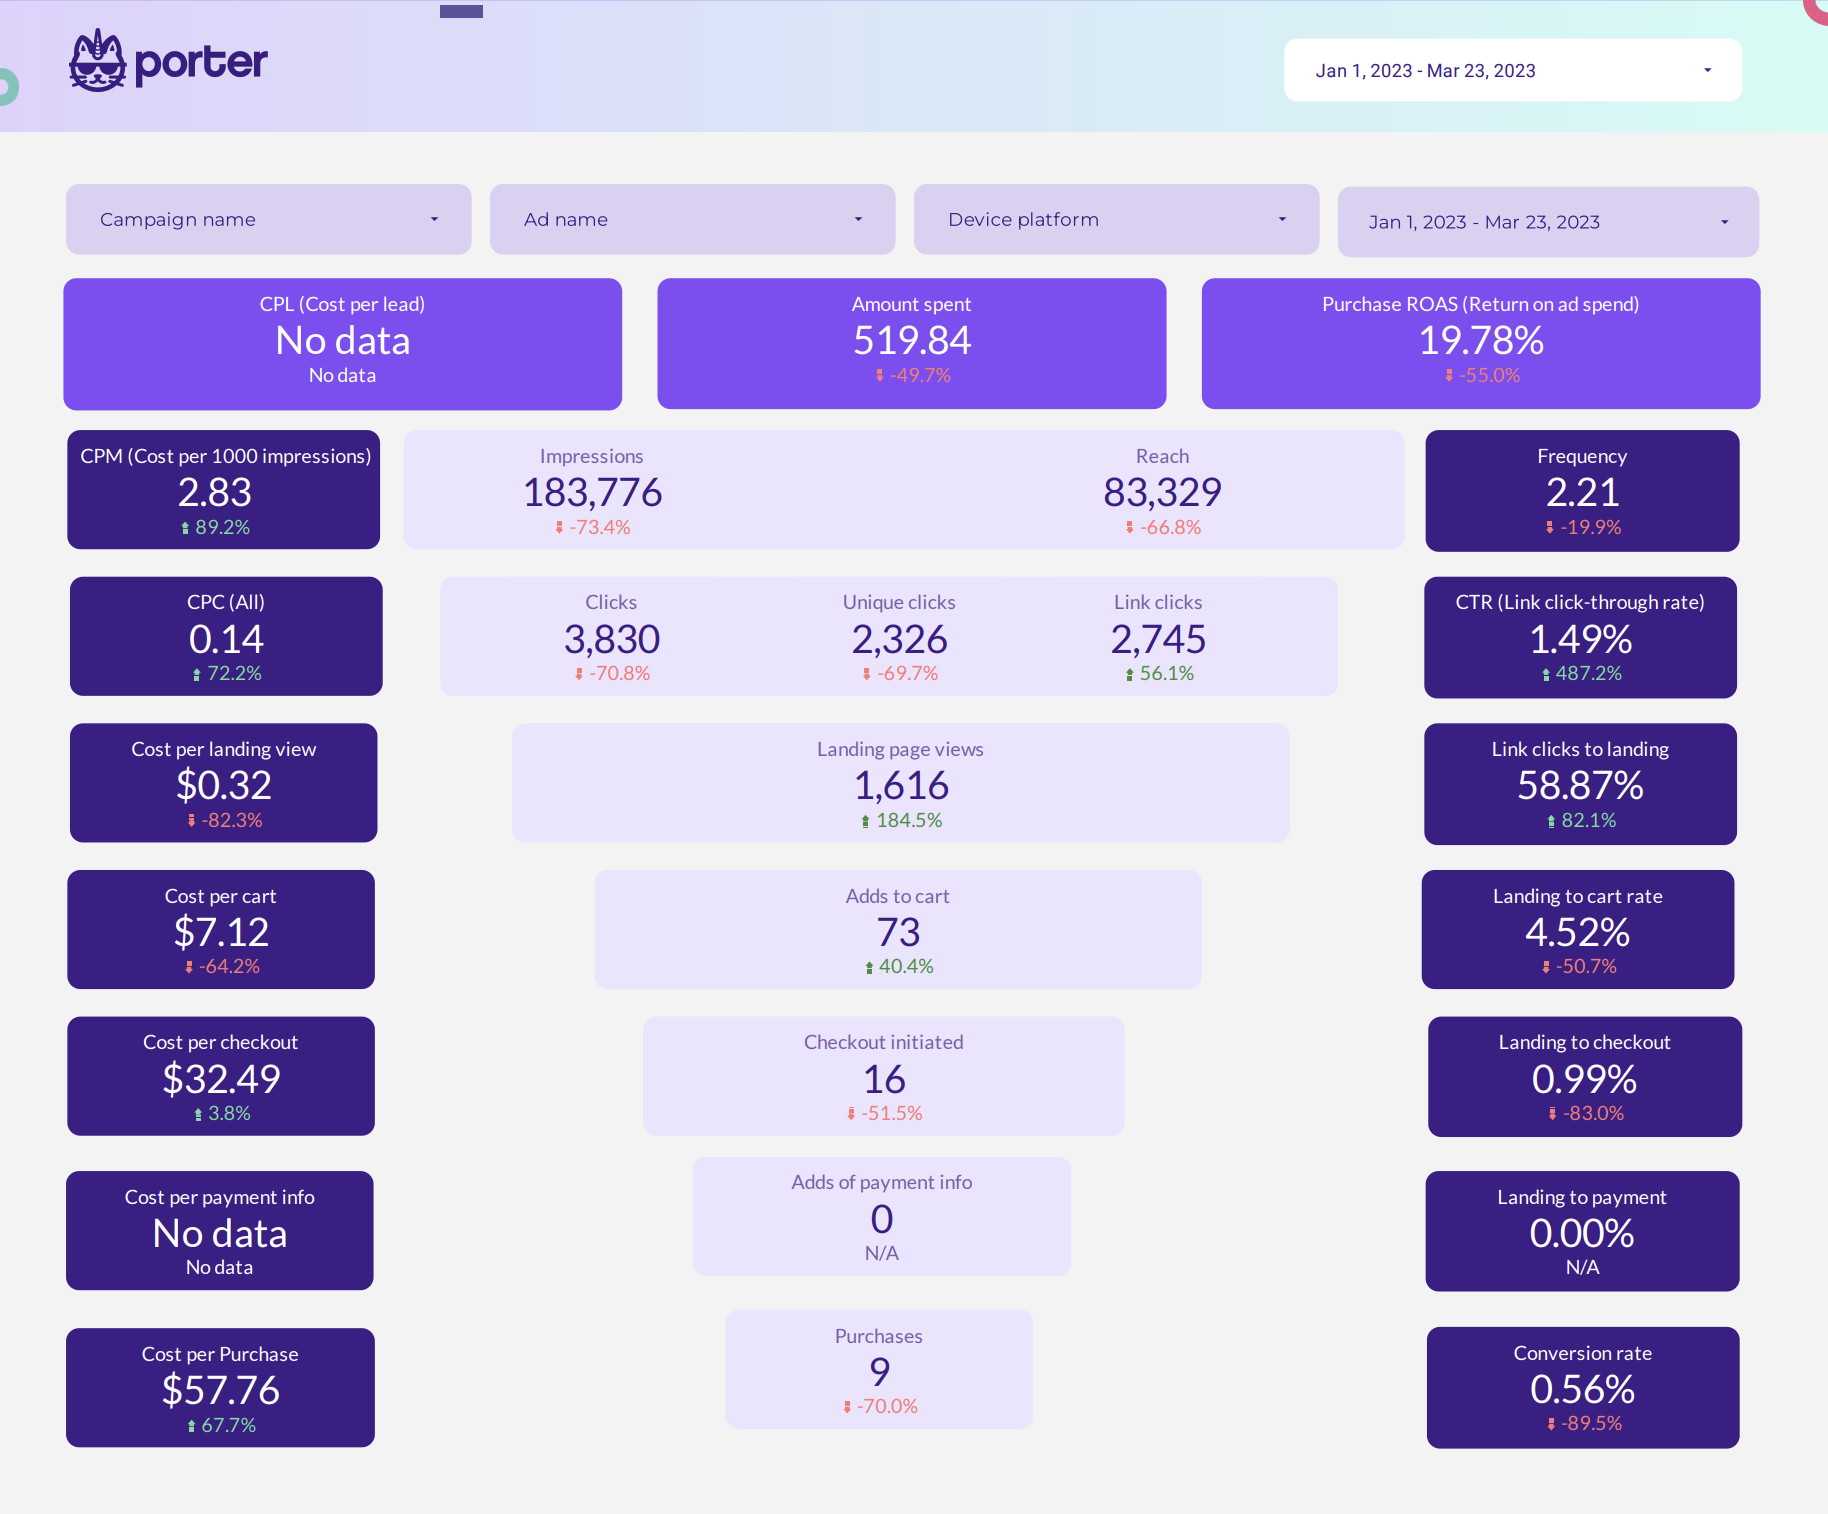
The Facebook Ads E-commerce funnel report template is part of the welcome kit we give away to our Facebook Ads connector users in both free trial and paid plan.
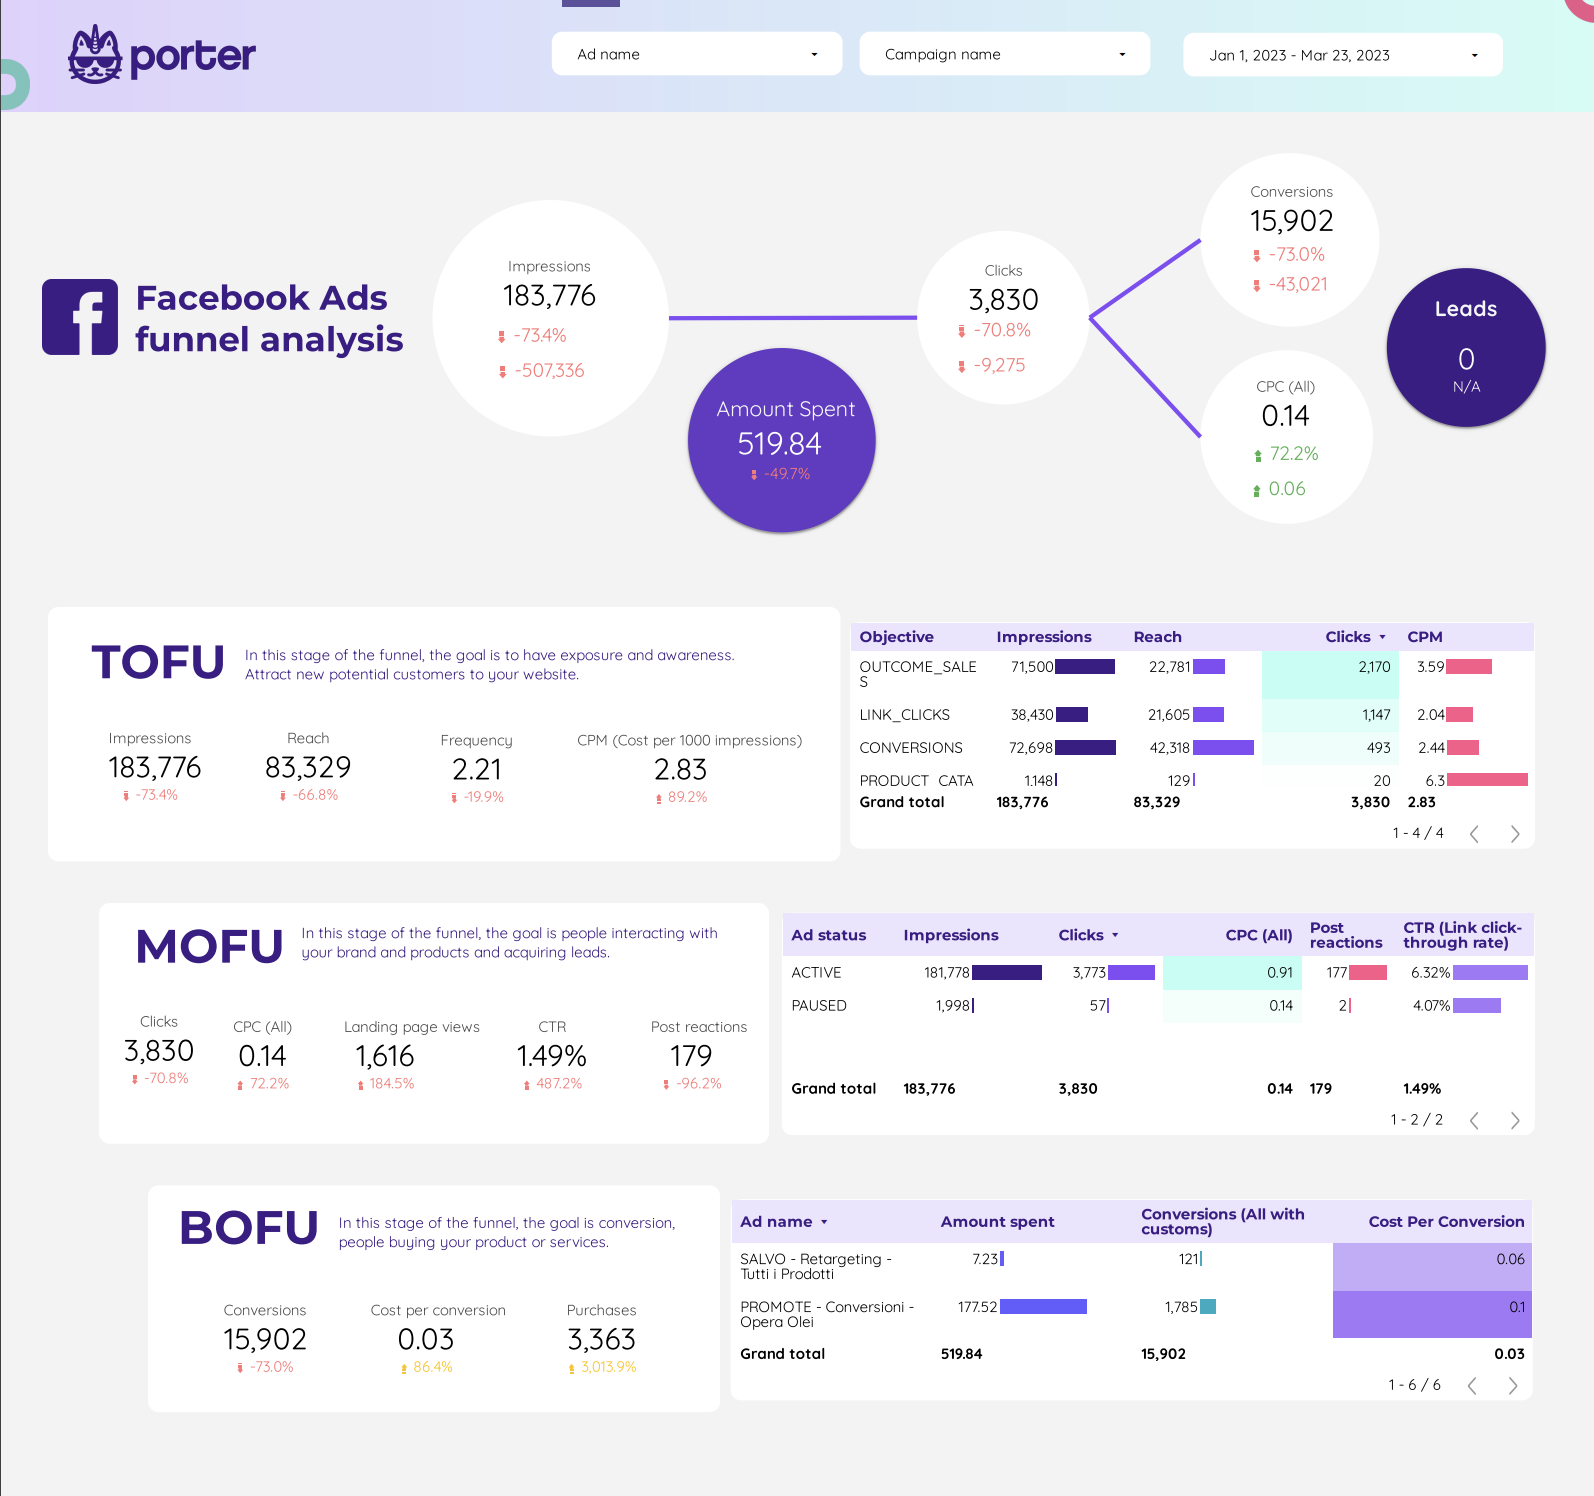
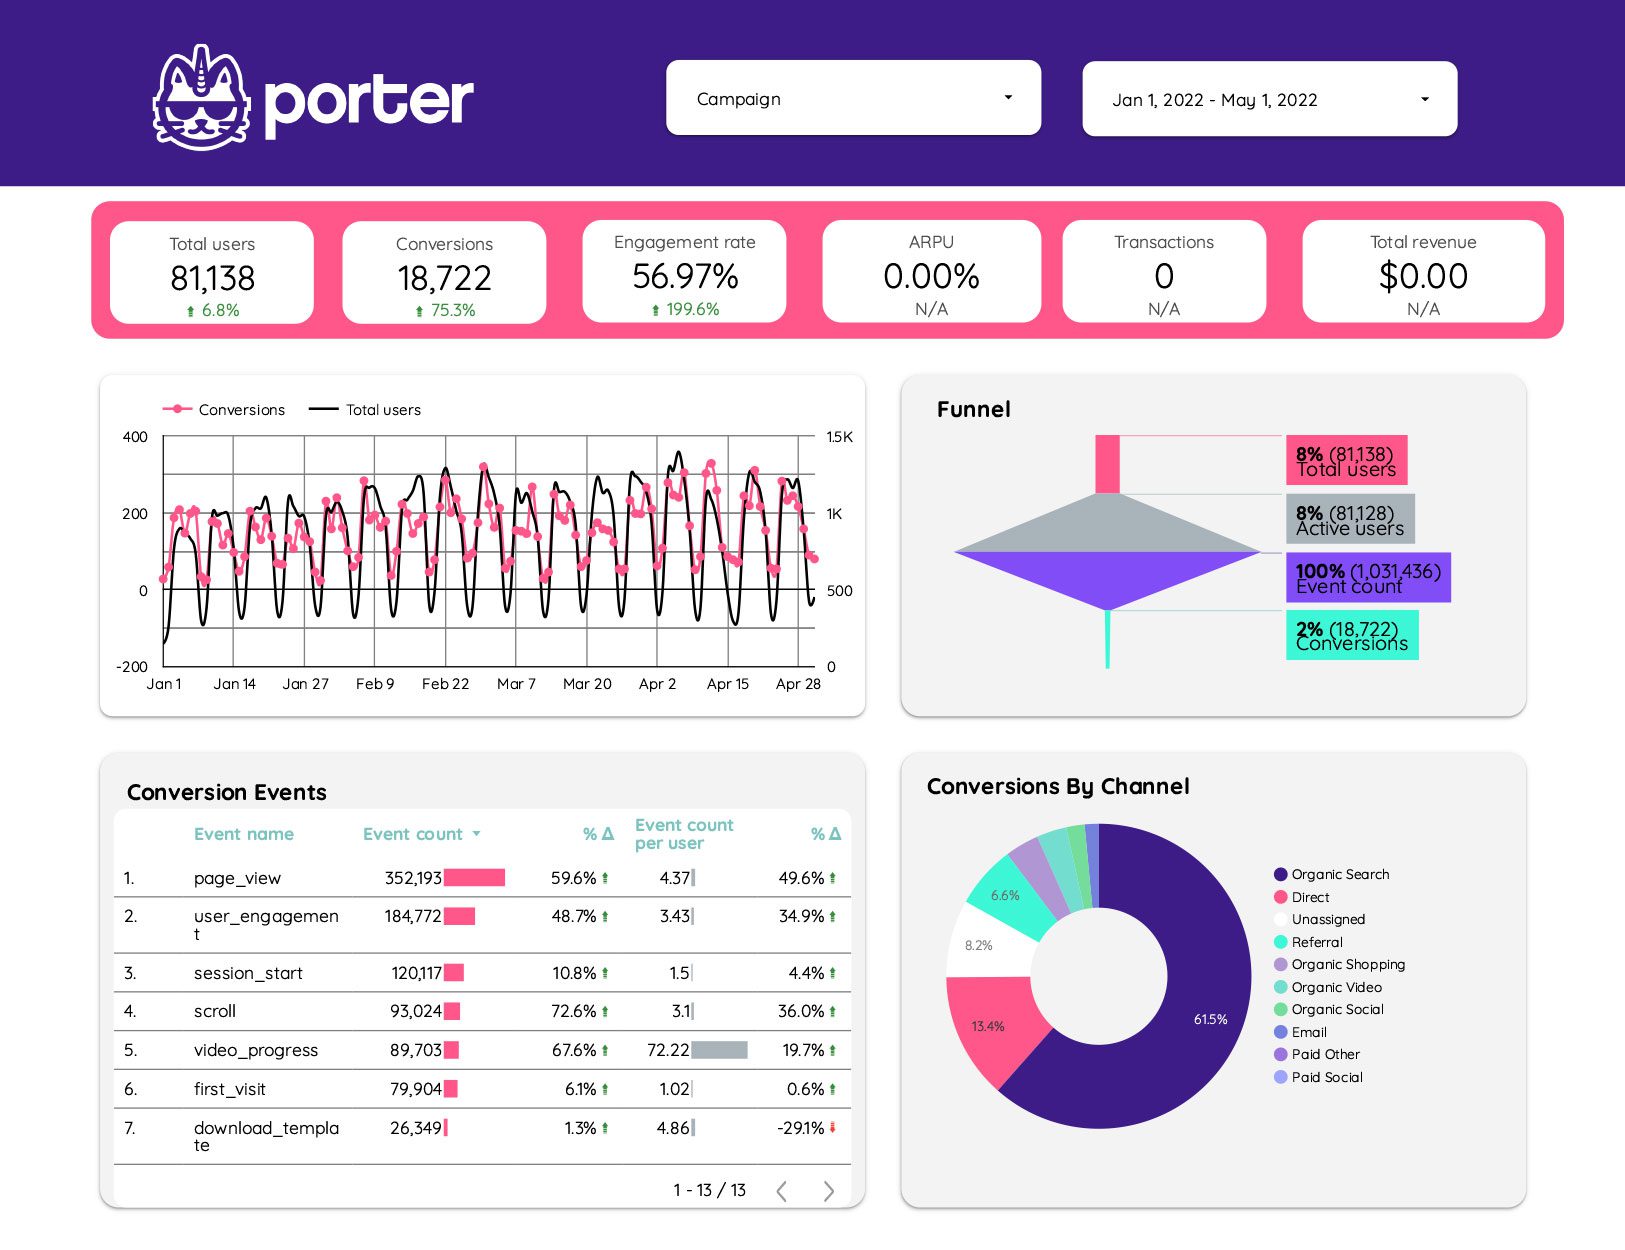
Visualize your marketing results as a funnel, get insights and understand how can you improve your conversion in every step of the customer journey.
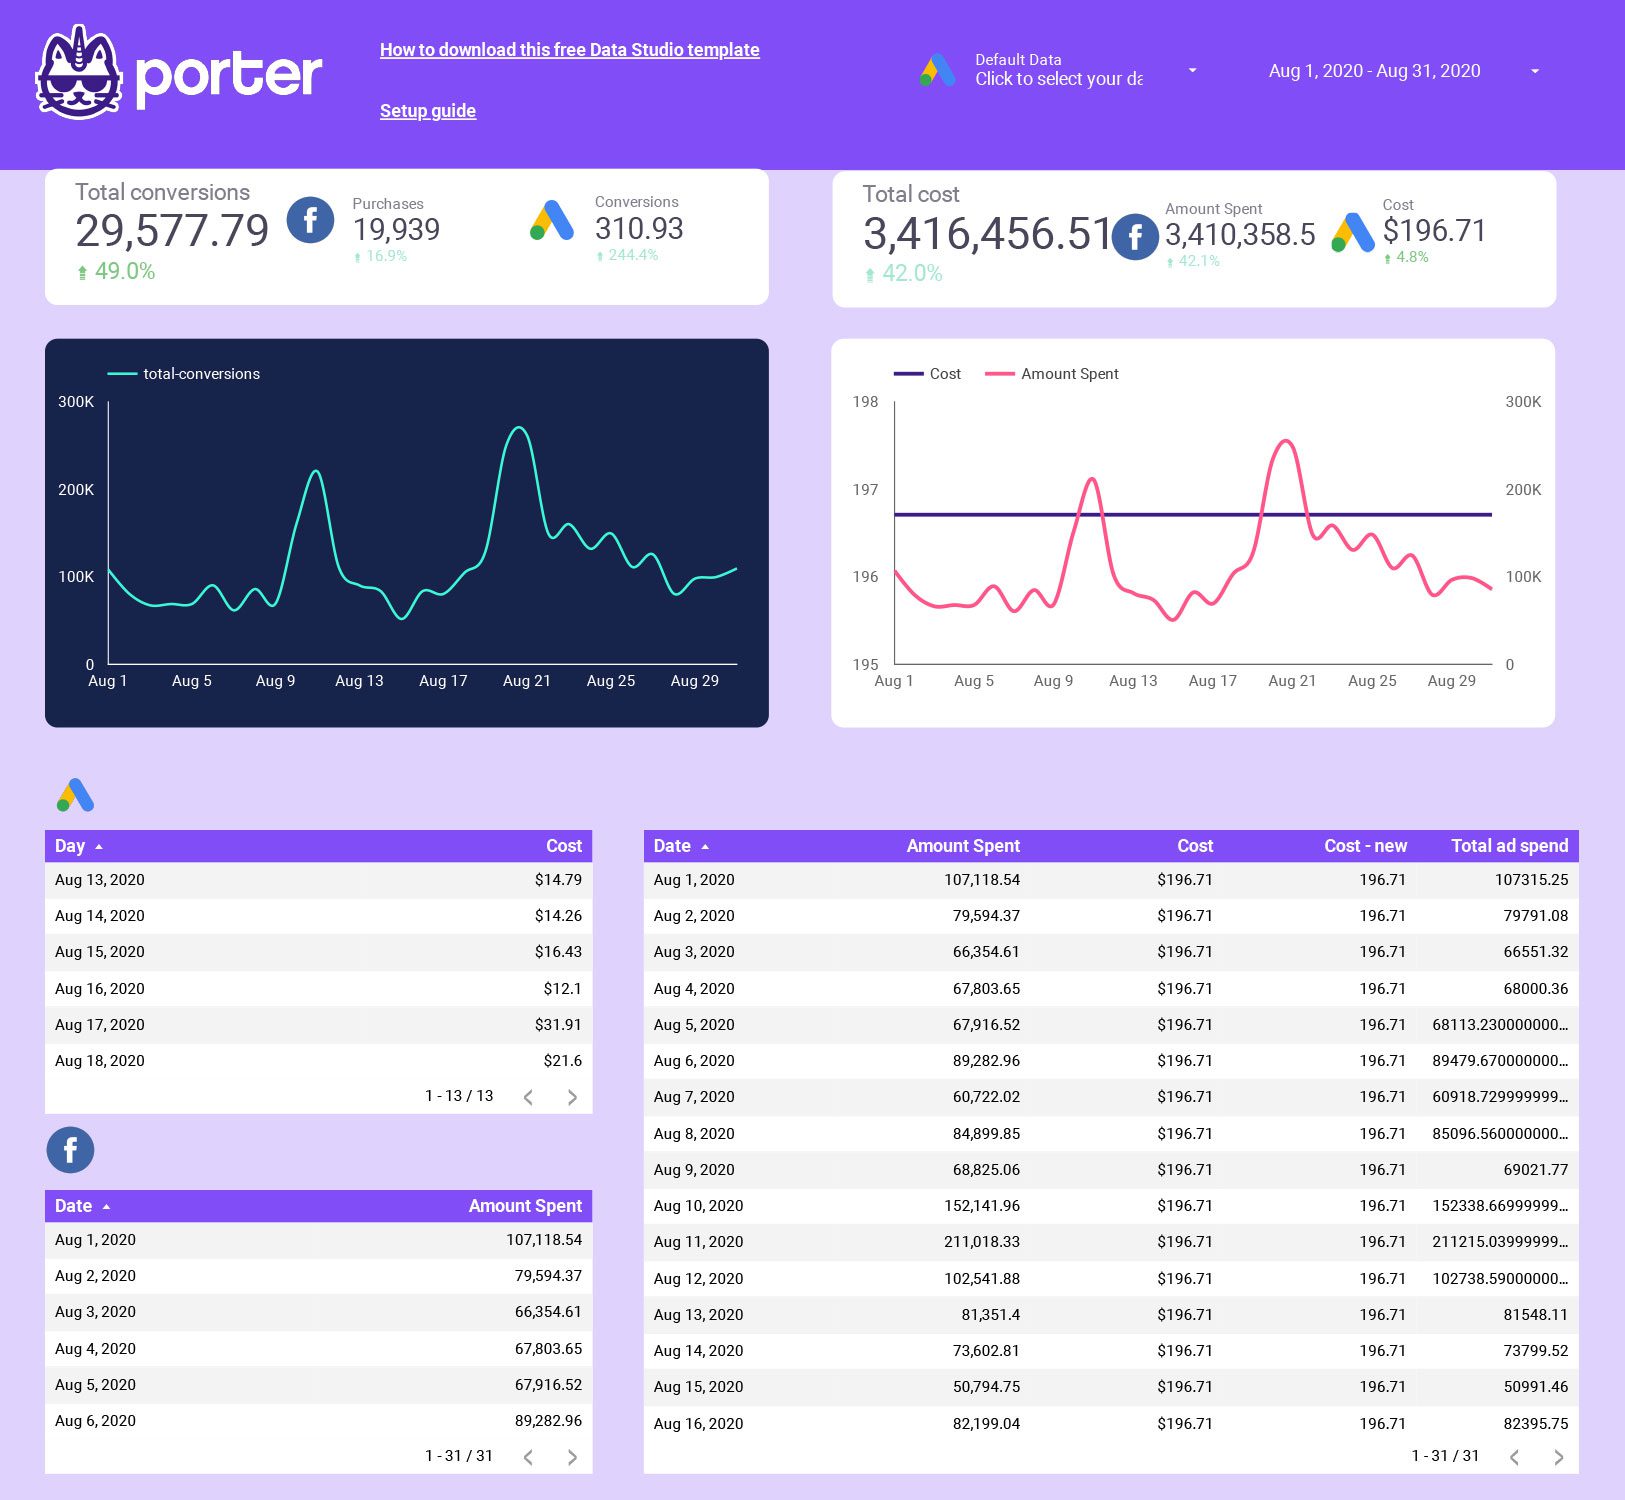
The value of Business Intelligence is gathering all your data in one place.
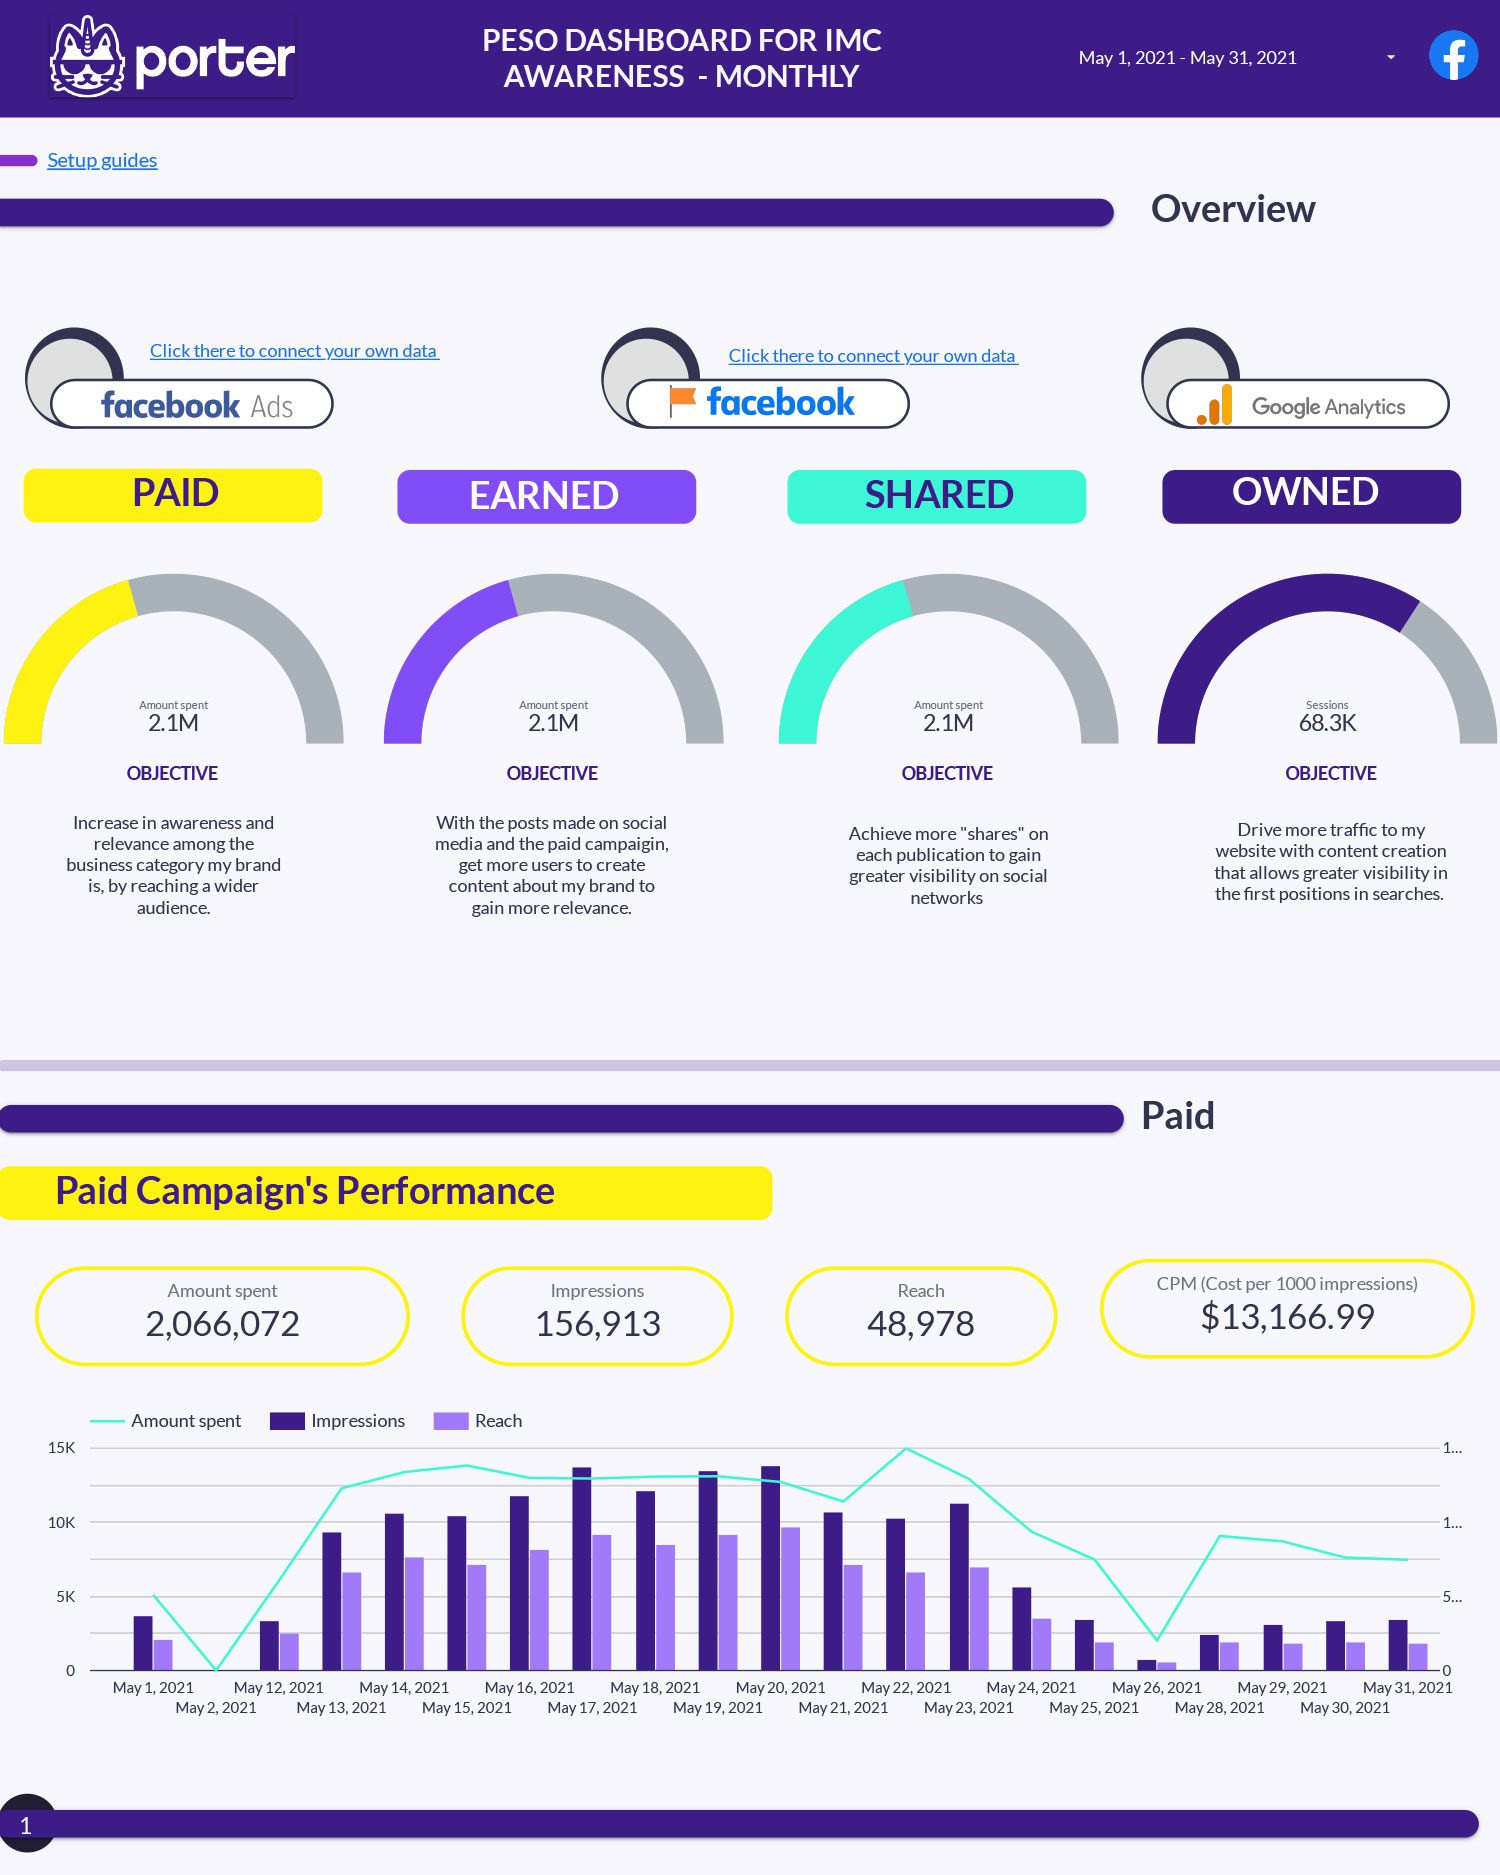
PESO is a media model strategy that stands for Paid, Earned, Shared, and Owned media. Download a free template to report your IMC (Integrated marketing communications) strategy.
Switching or migrating data from UA to GA4 might be a little struggling for most marketers, but not for you. Because this report template will help you with the principal metrics you need to analyze from now on Google Analytics 4.
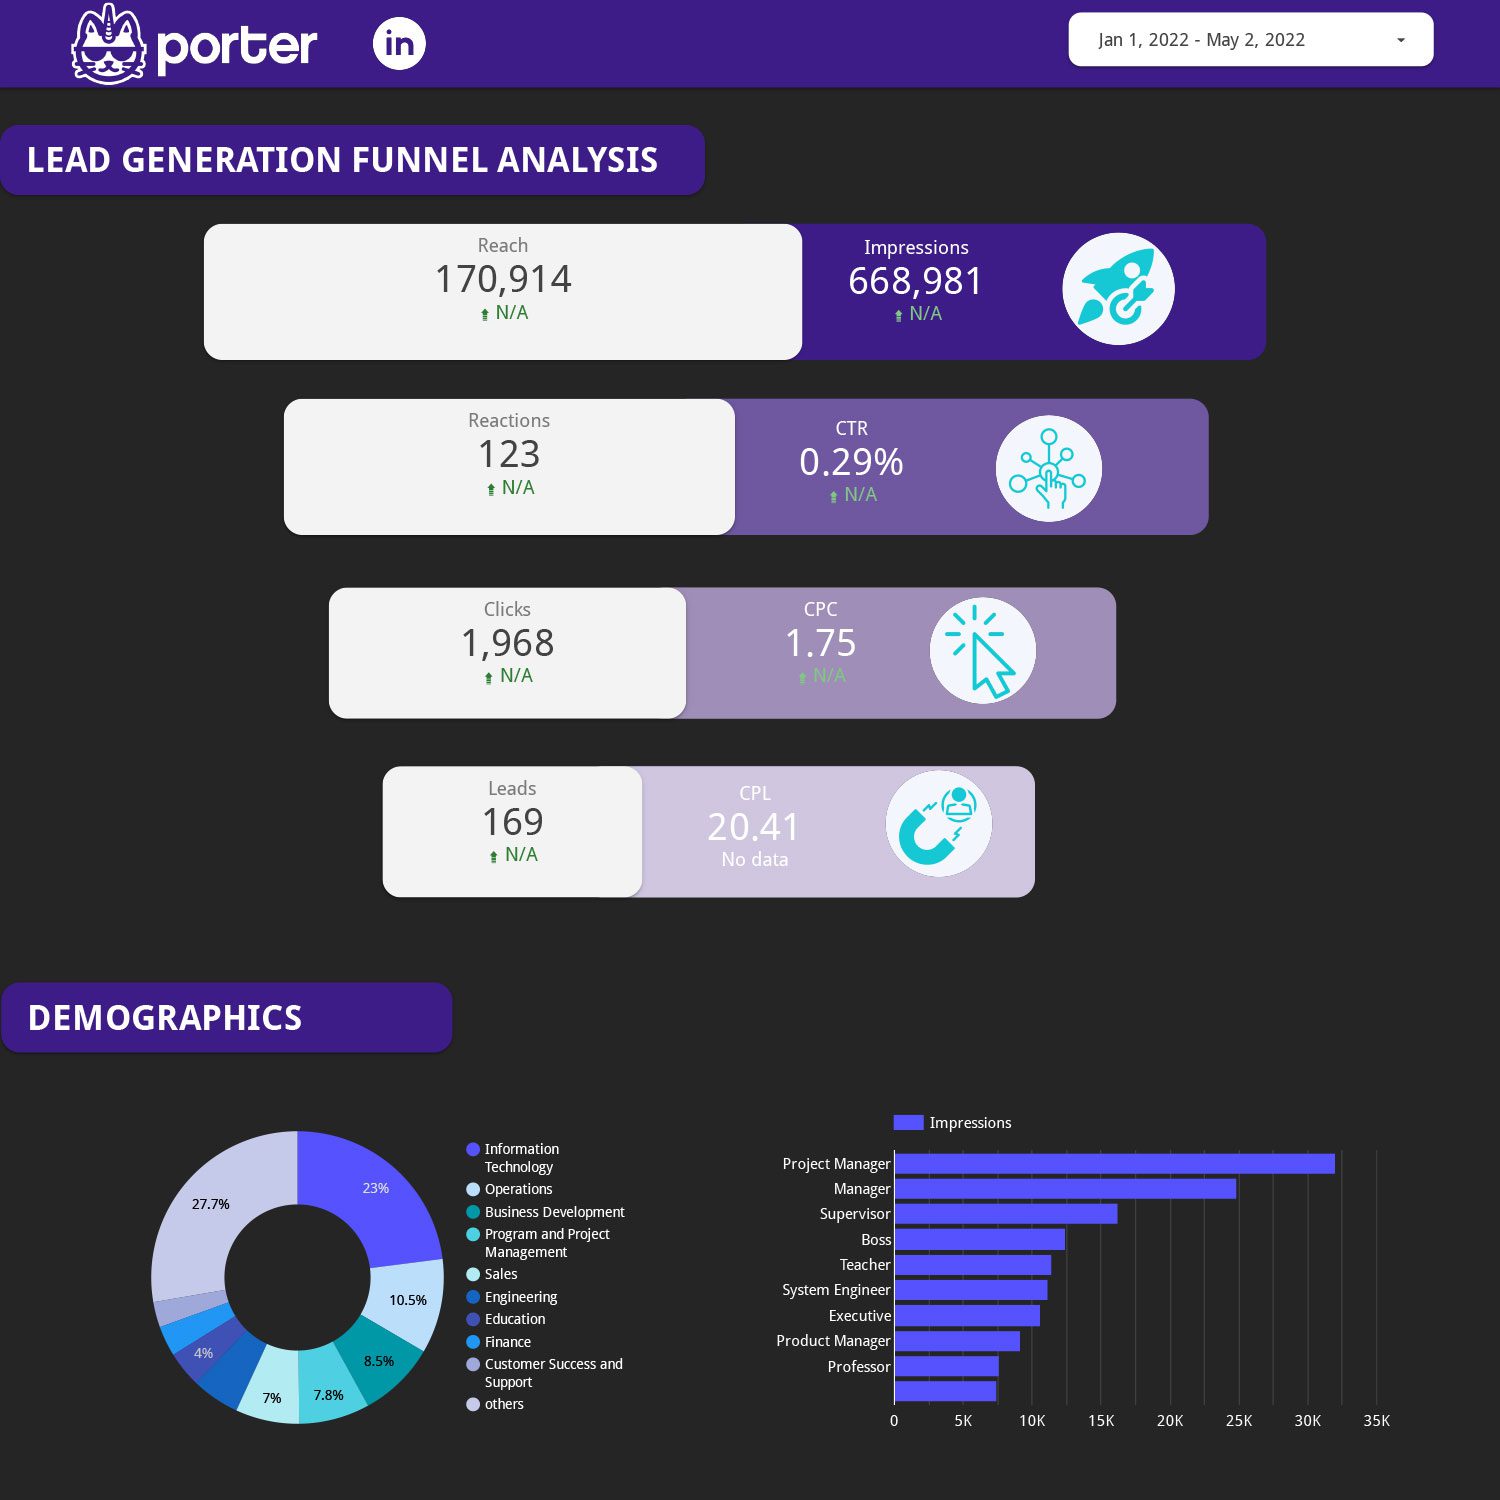
Track your lead generation campaigns, understand your ad performance, measure conversion and make campaigns that converts.
Visualiza tu desempeño SEO en una sola ojeada: cuánto trafico orgánico llega a tu web, con qué palabras clave estás ranqueando y qué páginas te generan más tráfico. Todo con los datos de Search Console.
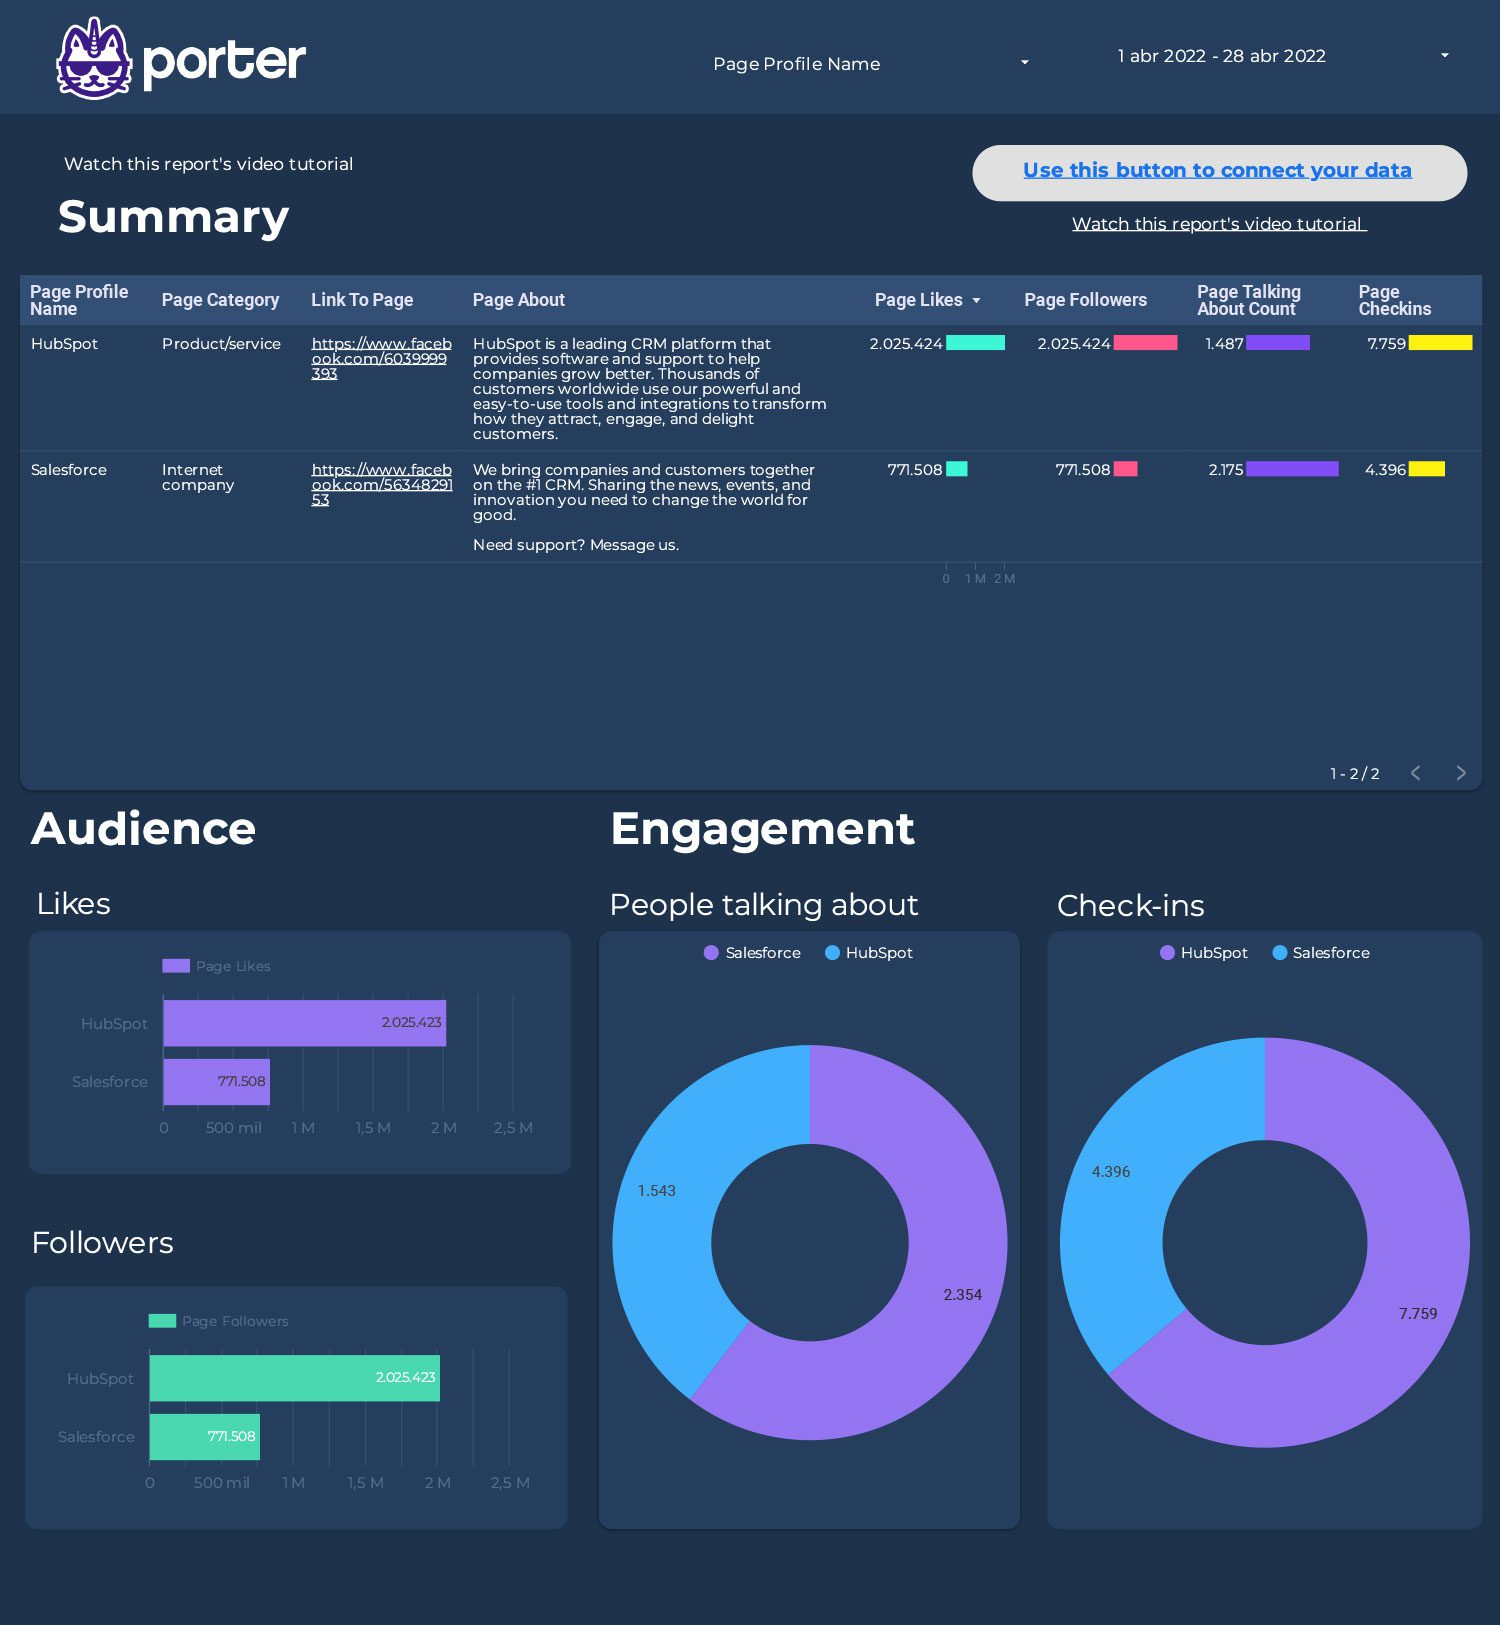
Download this visualization to track your competitors’ Facebook Pages. Pull and visualize data all for FREE with our Porter Facebook Competitors connector.
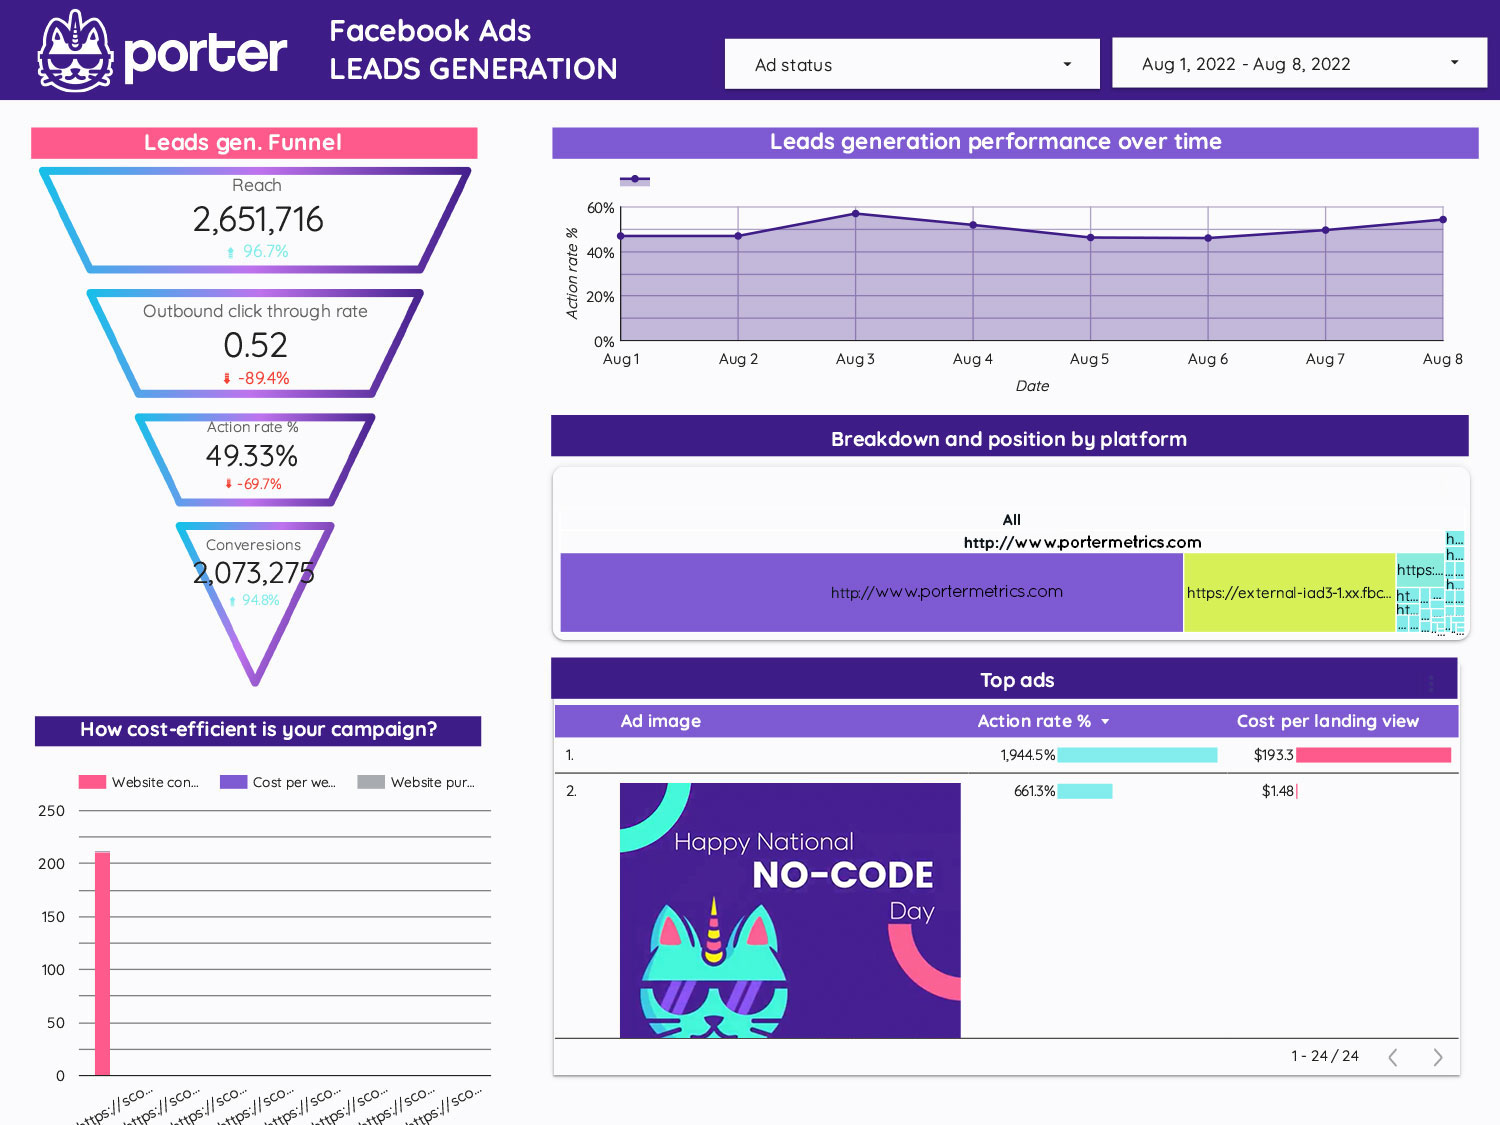
Explore everything you need to know about acquiring leads in your Facebook Ads campaigns. You will find an ad analysis that will help you identify which ads are most effective in getting conversions on your website.