
Facebook and Google ads performance Data Studio template (by an ex-Googler)
This template is inspired and brought by an ex-Googler and Google Marketing Expert.
Our new report template connects Facebook Insights and YouTube to show you the impact and performance of your video content pieces. You’ll be able to see things like view-through rate, video completion rate, Facebook video engagement, and YouTube content engagement. So you can make data-driven decisions about your video marketing strategy.
You can find related templates to “Google Business Profile” on our SEO reports’ gallery.
You can use this free template to visualize all your video content metrics in one place. Make a copy of this report and start filling in your data. The template includes a complete page with:
This template was created and influenced by real-world examples. It would be perfect for tracking and comparing your video content across platforms. You can also see how your videos perform over time.
To use this template, simply make a copy and set up your data sources to use this template.
There are different metrics that you can include in this report. However, this free template covers the main video content metrics essential for digital marketers and content creators. Here are some examples of what you could track:
These metrics will give you an idea of how well your videos are performing and where you need to improve.
This report template will help you answer questions such as:
Take a look and review all the metrics available for Facebook and YouTube.
![]() | How to connect Google Search Console to Data Studio. |
![]() | How to connect Instagram to Data Studio. |
![]() | How to connect Google Sheets to Data Studio. |
Porter Metrics is a non-code reporting tool that allows you to automate your Data Studio reports in some minutes, which means you don’t have to be a developer or a Google Data Studio specialist. We have already created templates, tutorials, and connectors to make Porter easy to use.
We recommend you visualize all your relevant KPIs directly on Google Data Studio Dashboards because it is one of the self-service platforms to automate data and it is also for free. If you are not familiar with Data Studio, you can learn how to use it through the following tutorial: Google Data Studio tutorial – 2022.
Marketers and agencies want eventually to customize their reports, adding their colors and using their brand guidelines. If you work with a customizable or a white-label, you will be able to customize your report as much as you can.
We have prepared this tutorial to show you how to customize your reports.
Through Google Data Studio you can share your reports via link or PDF. These are different ways to share your Facebook Ads report:
You can also learn more about his topic in the following tutorial: How to share your Google Data Studio reports.
You can use Data Studio to add different charts according to your need and how you want to visualize your data. These are some examples that you can use on your reports.
You can also customize these charts and change their color and sizes. Follow this video tutorial to learn how to create graphics and charts on your Data Studio reports.
You can also review the following article to create a new email delivery schedule for Google Data Studio.
Filters and controls on Google Data Studio make your reports interactive and clean your data.
For example, you can use the filters on your report to filter your “campaign objectives” or “camping names” and analyze the performance metrics just for some of them, excluding the campaigns that were meant for engagement rather than lead generation.
We have already created the following tutorial to show you how to create filters and controls on Google Data Studio.
In the same report view, you can combine data from multiple sources like Twitter, Google, Shopify, and more, so you truly have everything in one place.
It is ok if you want to set up your report, but if you need help with it, feel free to contact our specialist team in charge. We can set up your reports for free!
We already have a tutorial to show you how to set up your report template, including use cases, charts customization, blending examples, and more.
If you are working with our report template, you need to know all the metrics and dimensions that belong to. For this reason, we’ve created this list.
This template is inspired and brought by an ex-Googler and Google Marketing Expert.
Visualize your Google Ads funnel, ad spend and sales—all in a single view. Break down your data into campaign, ad sets and devices.
The value of Business Intelligence is gathering all your data in one place.
You can also review all our social and advertising report templates.
We know how powerful this report template is, and we also know how connecting this report with others apps can help you to have a full overview of your social media platforms.
You can check our connector list to review similar connectors such as Instagram Ads and Google Ads to create a cross-channel ads report visualizing your total ad spend and conversions across your paid channels.
Learn how to connect your report template with other apps in the following tutorial: Google data studio – Blending data.
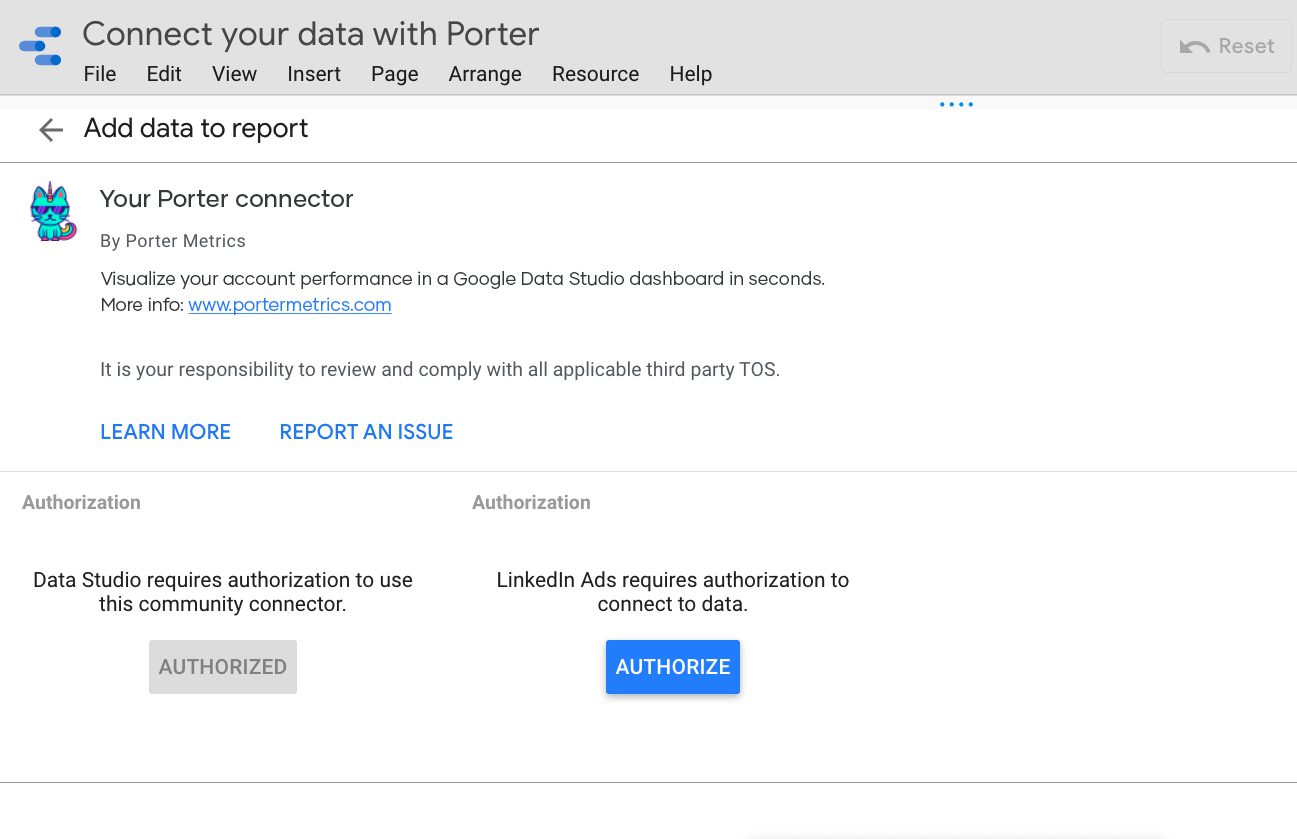
This report template is really for free, and you can copy it and use it whenever you want. However, you need to pull your data from the Porter Metrics.
Once you have successfully created a copy for this template, you will start a 14-days free trial with us. Also, you will choose a paid plan to upgrade your porter metric account and keep the connector working.
Note: If you don't want to upgrade a plan with Porter, you may keep with the template, but the connectors will stop working, which means your data won't be available in this stunning and comprehensive template.
Once you have set up your advertising report template, you will follow these steps to analyze your data:
You can customize your report by creating new charts, adding filters and controls, custom formulas, colors, logos, and changing the size of your canvas.
We have created the following video tutorial to show you all these options to customize your SM report template: How to customize a Google Data Studio report.
As we have shown you, Porter Metrics has been created as a non-code platform for marketers and agencies to automate your Data Studio reports in some minutes.
The difference between Porter Metrics and competitors is the non-code and the resources that Porter Metrics offers. You can also review this reporting tools list to know all the solutions available, including Porter Metrics and competitors.
Please make a copy of this funnel report template and use it now to track your campaigns. As we show you, these are the steps:
Remember, if you need help to set up your report or star tour free trial, you can schedule a call, and we will be happy to help you.
Porter is the fastest way to get your marketing metrics and dashboards where you need them.